8 min read
The Passenger Who Never Boarded: Transit Planning's Invisible Problem

Written by Dr. Ümit Kuvvetli
Founder & Chief Optimization Scientist
Eskişehir, 07:51 on a Tuesday
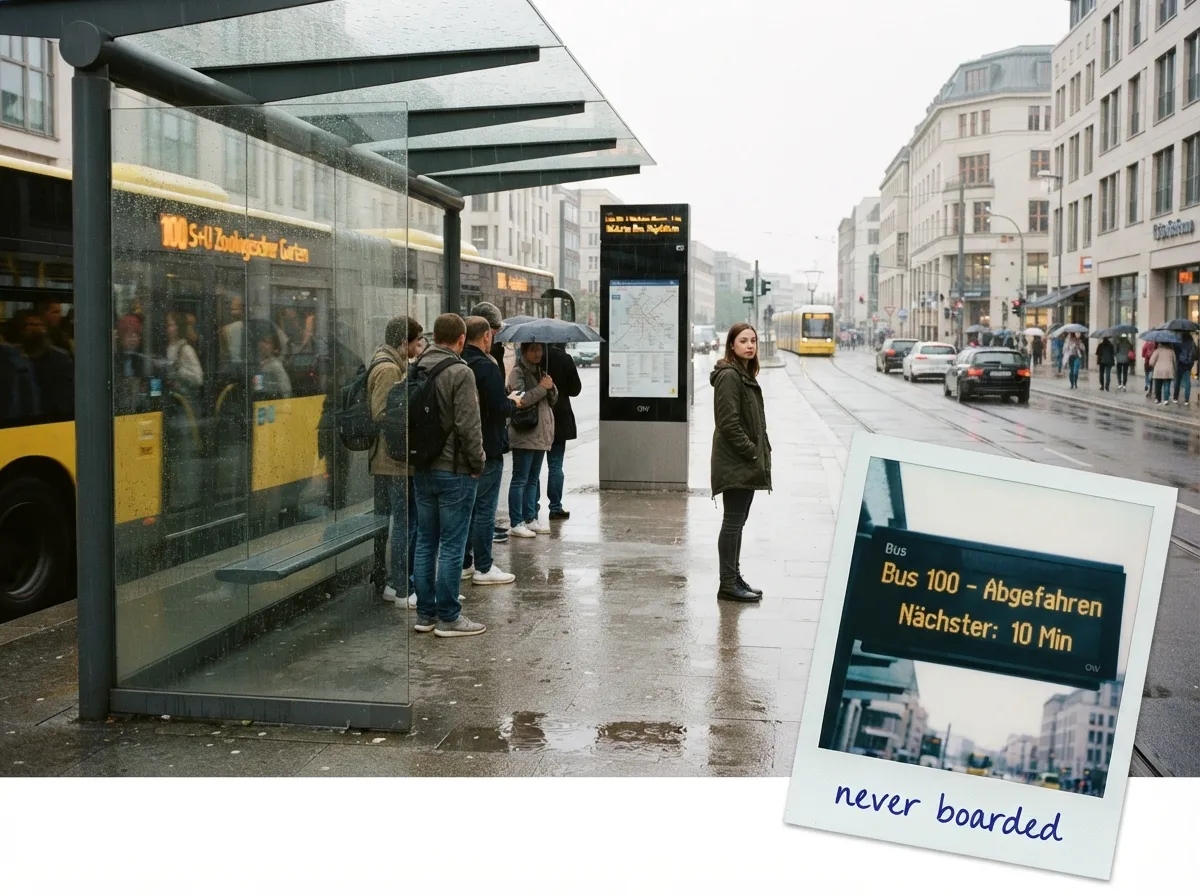
She arrived at the stop at 07:48. Right time. Right stop.
The bus came. The doors opened. One look inside was enough — standing room only, bodies pressed together, no air. The doors closed. The bus left.
The next one: 23 minutes away. Her appointment: 09:00. A job interview, across from the hospital.
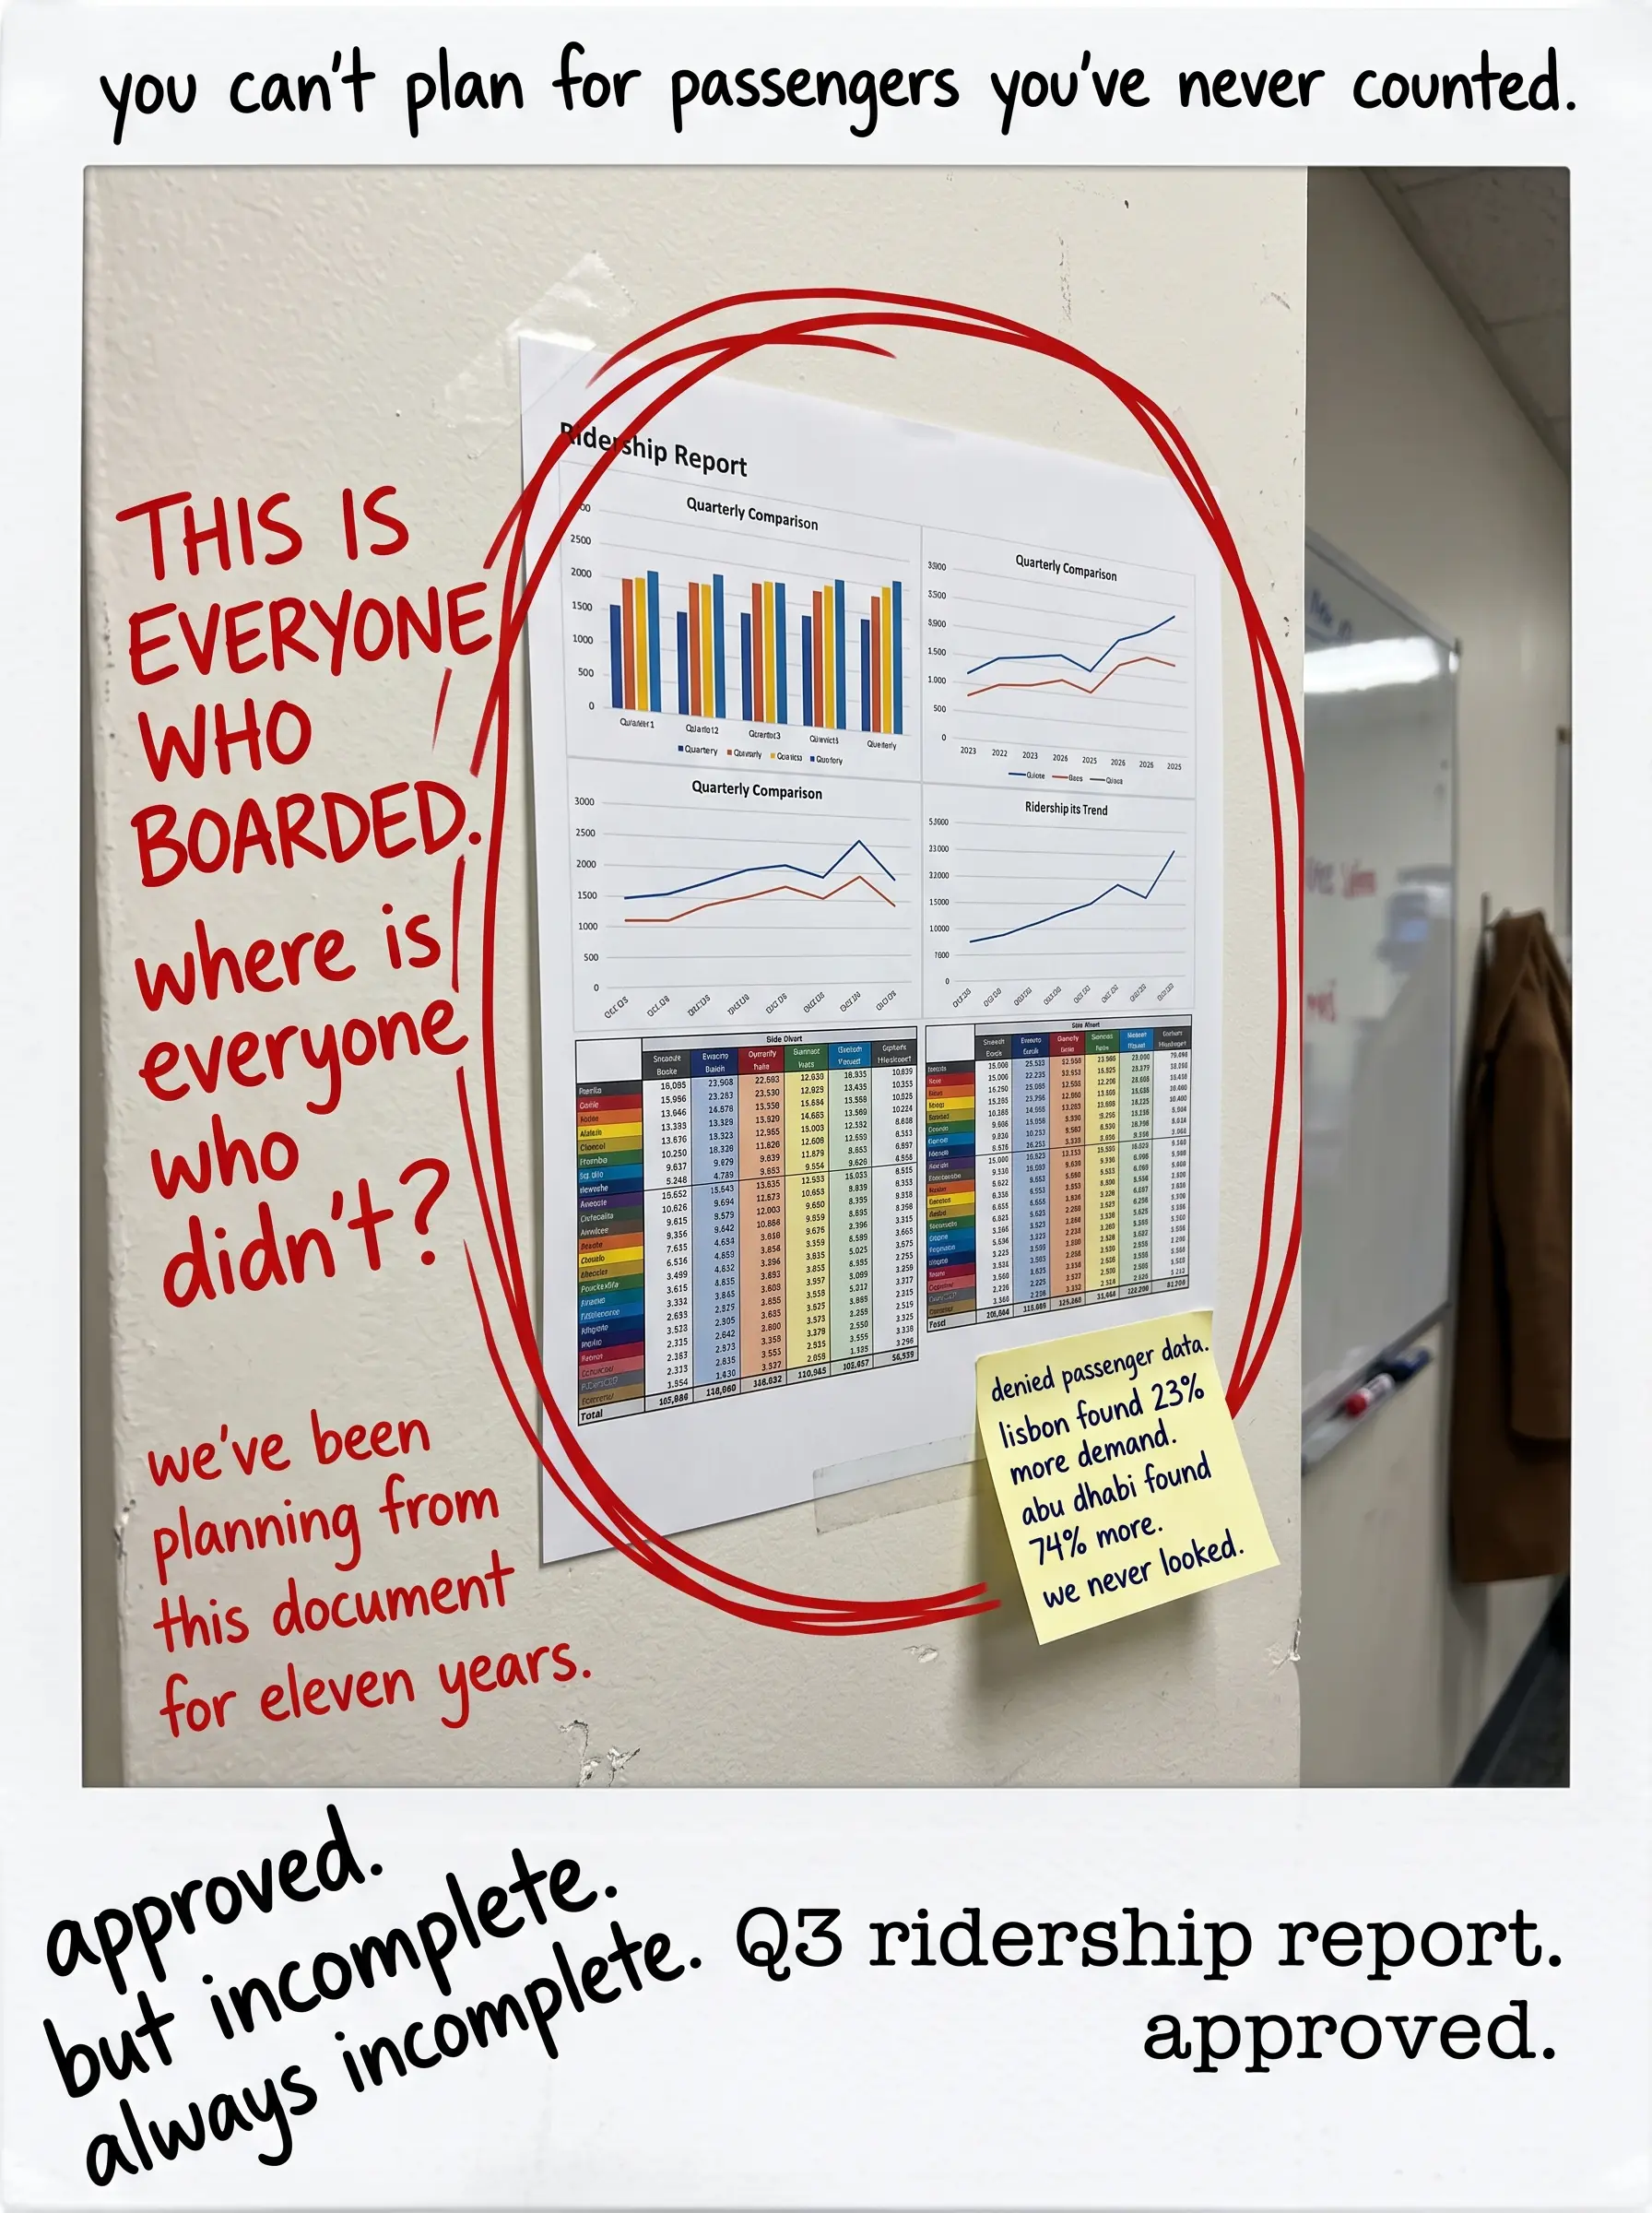
According to the system, she was served. A bus came. The route logged as operational. The stop registered activity. The line appeared at capacity.
Did she board? No.
Does the system know that? No.
Does the planning model account for it? No.
This is where transit planning goes blind.
What Is a Denied Passenger?
In transit literature, a denied passenger is anyone who attempts to use the system and cannot — or anyone who decides not to attempt because experience has taught them the system will fail them.
But the problem runs deeper than a full bus and a closed door.
Denied passengers appear in three distinct forms:
- Form 1 — Direct denial: The bus is full. The passenger cannot board. The doors close in their face. This is the most visible form — and the least common measured in planning models.
- Form 2 — Discouraged passenger: The system is sufficiently unreliable that the passenger stops trying. They don't go to the stop. They take a car, call a taxi, or cancel the trip entirely. The system never sees this person.
- Form 3 — Latent demand: Service has never existed in this area, or has existed so poorly for so long, that no demand registers at all. The passenger has stopped looking for alternatives. They have adapted their life around the system's absence. The system doesn't know this demand exists because it has never measured it.
The sum of these three forms represents a number far larger than most cities' current ridership.
And none of it appears in the database.
Why Is It Invisible?
Traditional transit planning is built on observed demand: how many people boarded, how many alighted, which stops are busy. This data is collected, analyzed, and used to adjust routes and frequencies.
It sounds rational. But it contains a fatal bias:
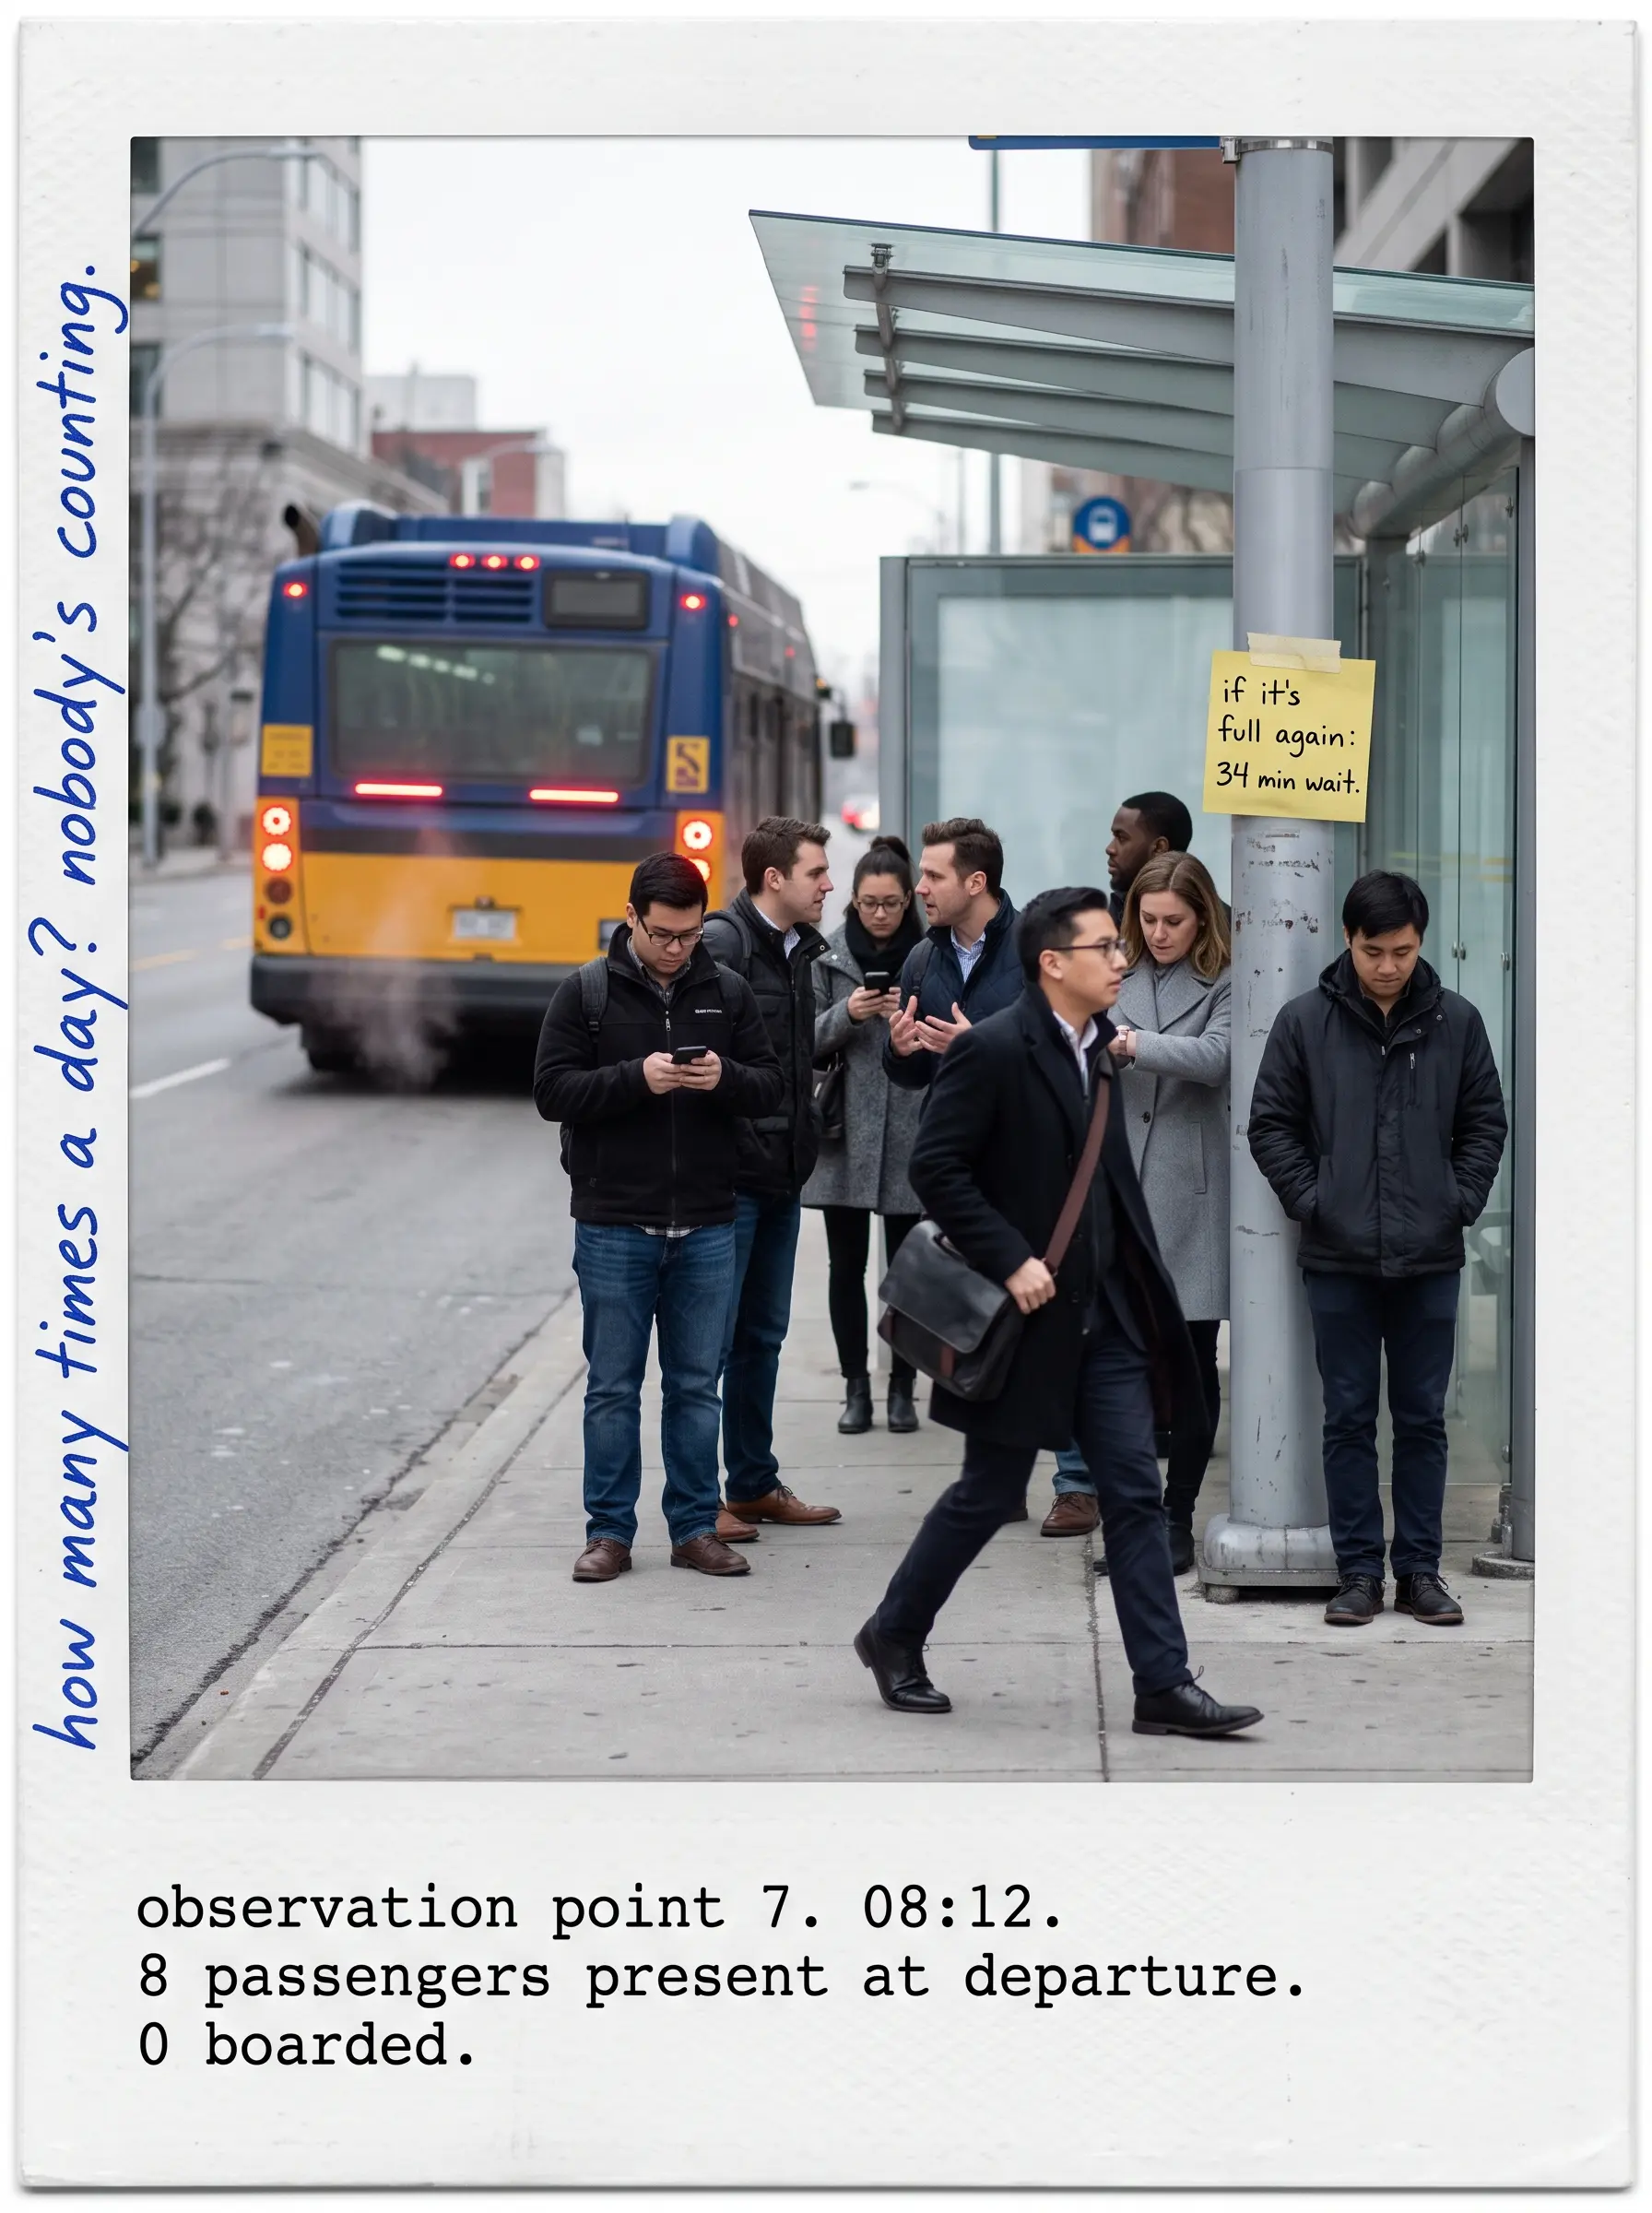
If you only count the passengers who board, you will never see the passengers who couldn't.
This is equivalent to measuring a restaurant's success by looking only at seated customers — ignoring everyone who turned away at the door, everyone who left a waiting list, everyone who decided long ago that this restaurant isn't worth trying. The restaurant looks full. Business looks good. But it's serving half its potential customers.
In transit, this illusion carries consequences far beyond lost revenue. It leads to cities that systematically underinvest in the places that need service most, because those places show the lowest ridership numbers — precisely because the service there is worst.
Eskişehir: The Anatomy of Suppressed Demand
Eskişehir has one of Turkey's more successful transit stories. An integrated tram network, multi-modal ticketing, reasonable frequency by domestic standards. But Eskişehir has blind spots.
The city's western periphery — rapidly developing residential areas built in the last decade — sits disconnected from the tram network. Bus service exists, but with two departures between 07:30 and 09:00.
What does a resident of this neighborhood do?
Week one: tries the bus. Week two: tries again. Week three: the bus runs full, passes the stop. Takes the car. One month later: doesn't go to the stop anymore.
What does the system see? Low utilization on the western route. Conclusion: frequency increase not justified — perhaps a reduction is warranted.
Reality: demand is suppressed. The system is running a self-reinforcing cycle: low frequency → perception of unreliability → fewer passengers → low frequency appears justified → low frequency continues.
Breaking this cycle requires seeing it first. Seeing it requires looking beyond observed demand.
Lisbon: Counting the People Who Walked Away
Lisbon is one of Europe's most challenging transit geographies. Seven hills. Narrow streets. A historic urban fabric that resists standard routing logic. A planner's permanent headache.
In 2019, Lisbon's metropolitan transport authority ran a study with a different question at its center. Not: "How many people are using our system?" But: "Who wants to use our system and isn't — and why?"
The findings were striking.
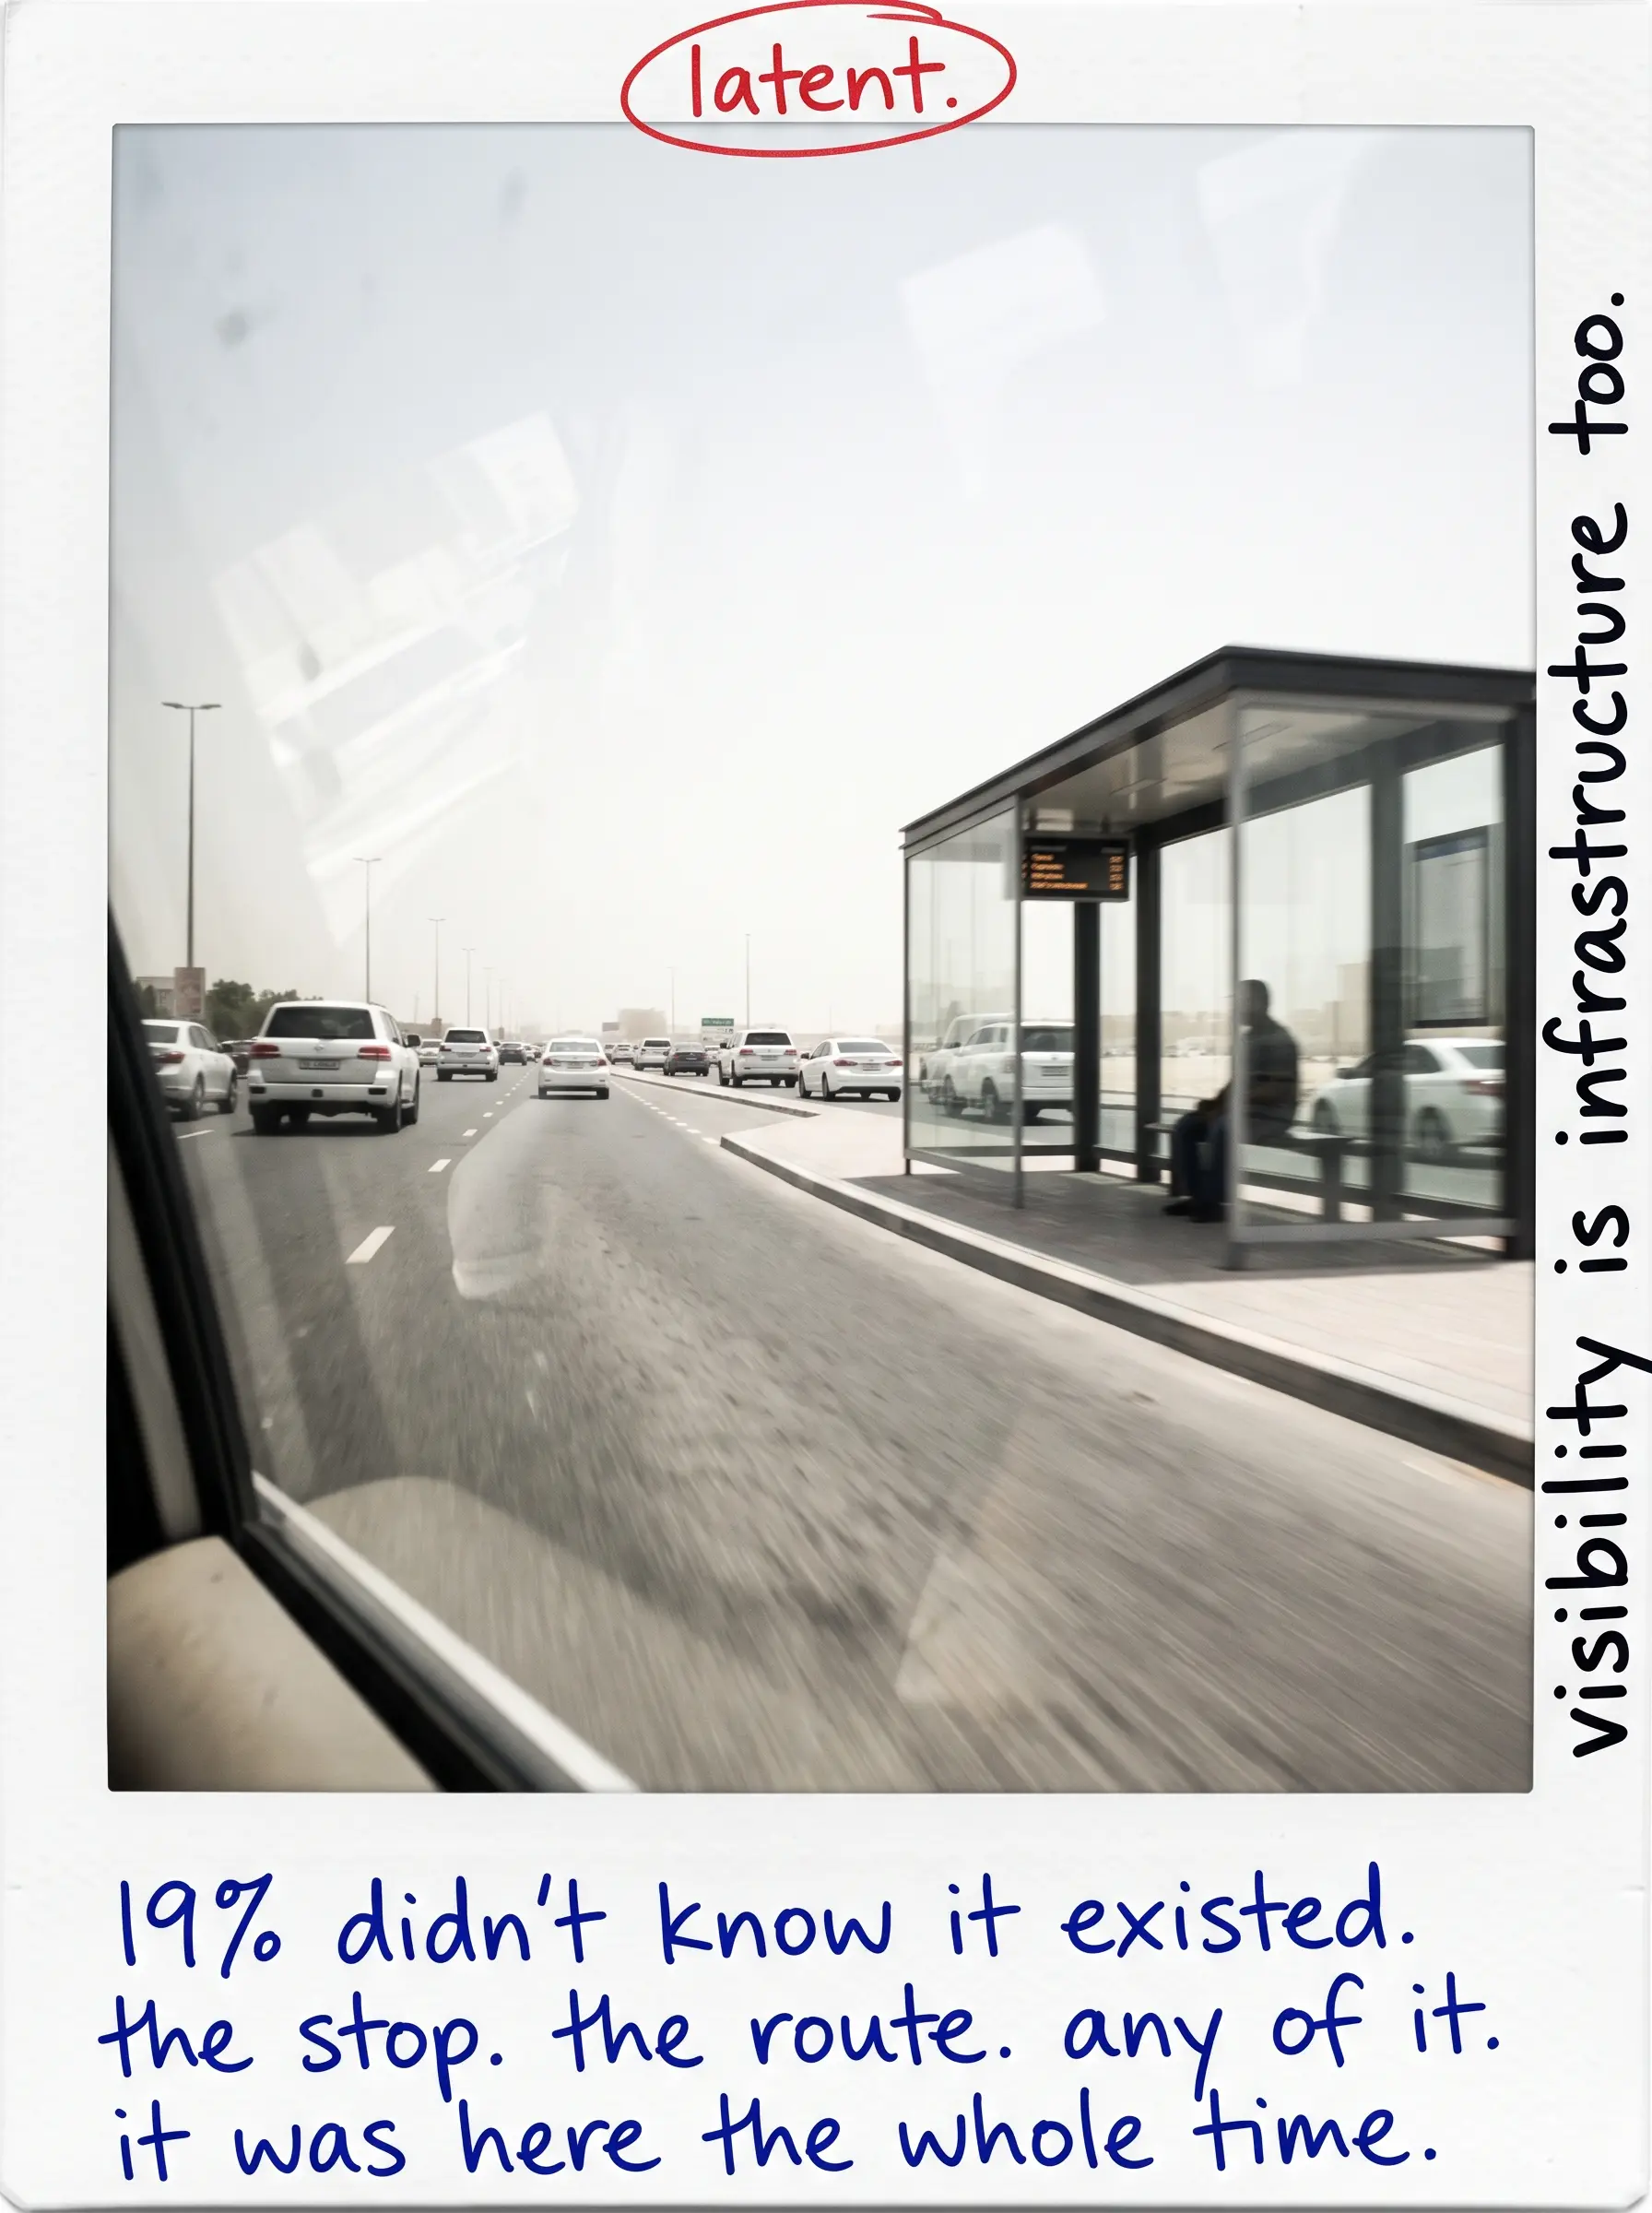
In Alfama, in Belém, in Mouraria — areas vibrant with life but dead in transit connectivity — a significant population of discouraged passengers was identified. These were people who wanted to use public transit. Who did not want to own cars. But who had been turned away by the system — confusing transfers, low frequency, unreliable information — often enough to stop trying.
What Lisbon found: latent demand running approximately 23% above current ridership. These people were invisible in every standard planning model. Because they had never boarded.
The response was not to build new routes. It was to increase frequency on existing routes and simplify transfer logic at key interchange points.
Two years later: ridership up 18%. No new vehicles. No new lines. Just a system that finally acknowledged the people it had been ignoring.
Abu Dhabi: Latent Demand in a City Built for Cars
Abu Dhabi presents a striking paradox. One of the world's wealthiest cities. Wide boulevards, modern infrastructure, and a built environment that assumes universal car ownership. And yet — public transit use remains remarkably low.
For years, the standard explanation was cultural: "People prefer driving here. The climate makes walking impossible. Transit isn't part of the culture."
These explanations were partially true. But they were also covering a deeper question that nobody had asked: Has anyone actually measured what demand exists?
In 2021, Abu Dhabi's Department of Transport launched a comprehensive latent demand assessment. The methodology was simple but transformative: instead of surveying current transit users, they surveyed people who had never used the system.
Three groups emerged:
- Group 1 — "I tried and stopped": Had used transit, abandoned it due to reliability or comfort failures. 31% of the non-user population.
- Group 2 — "The stop is too far": Service exists but is physically inaccessible — the walk from home or work to the nearest stop exceeds what this person considers reasonable. 24%.
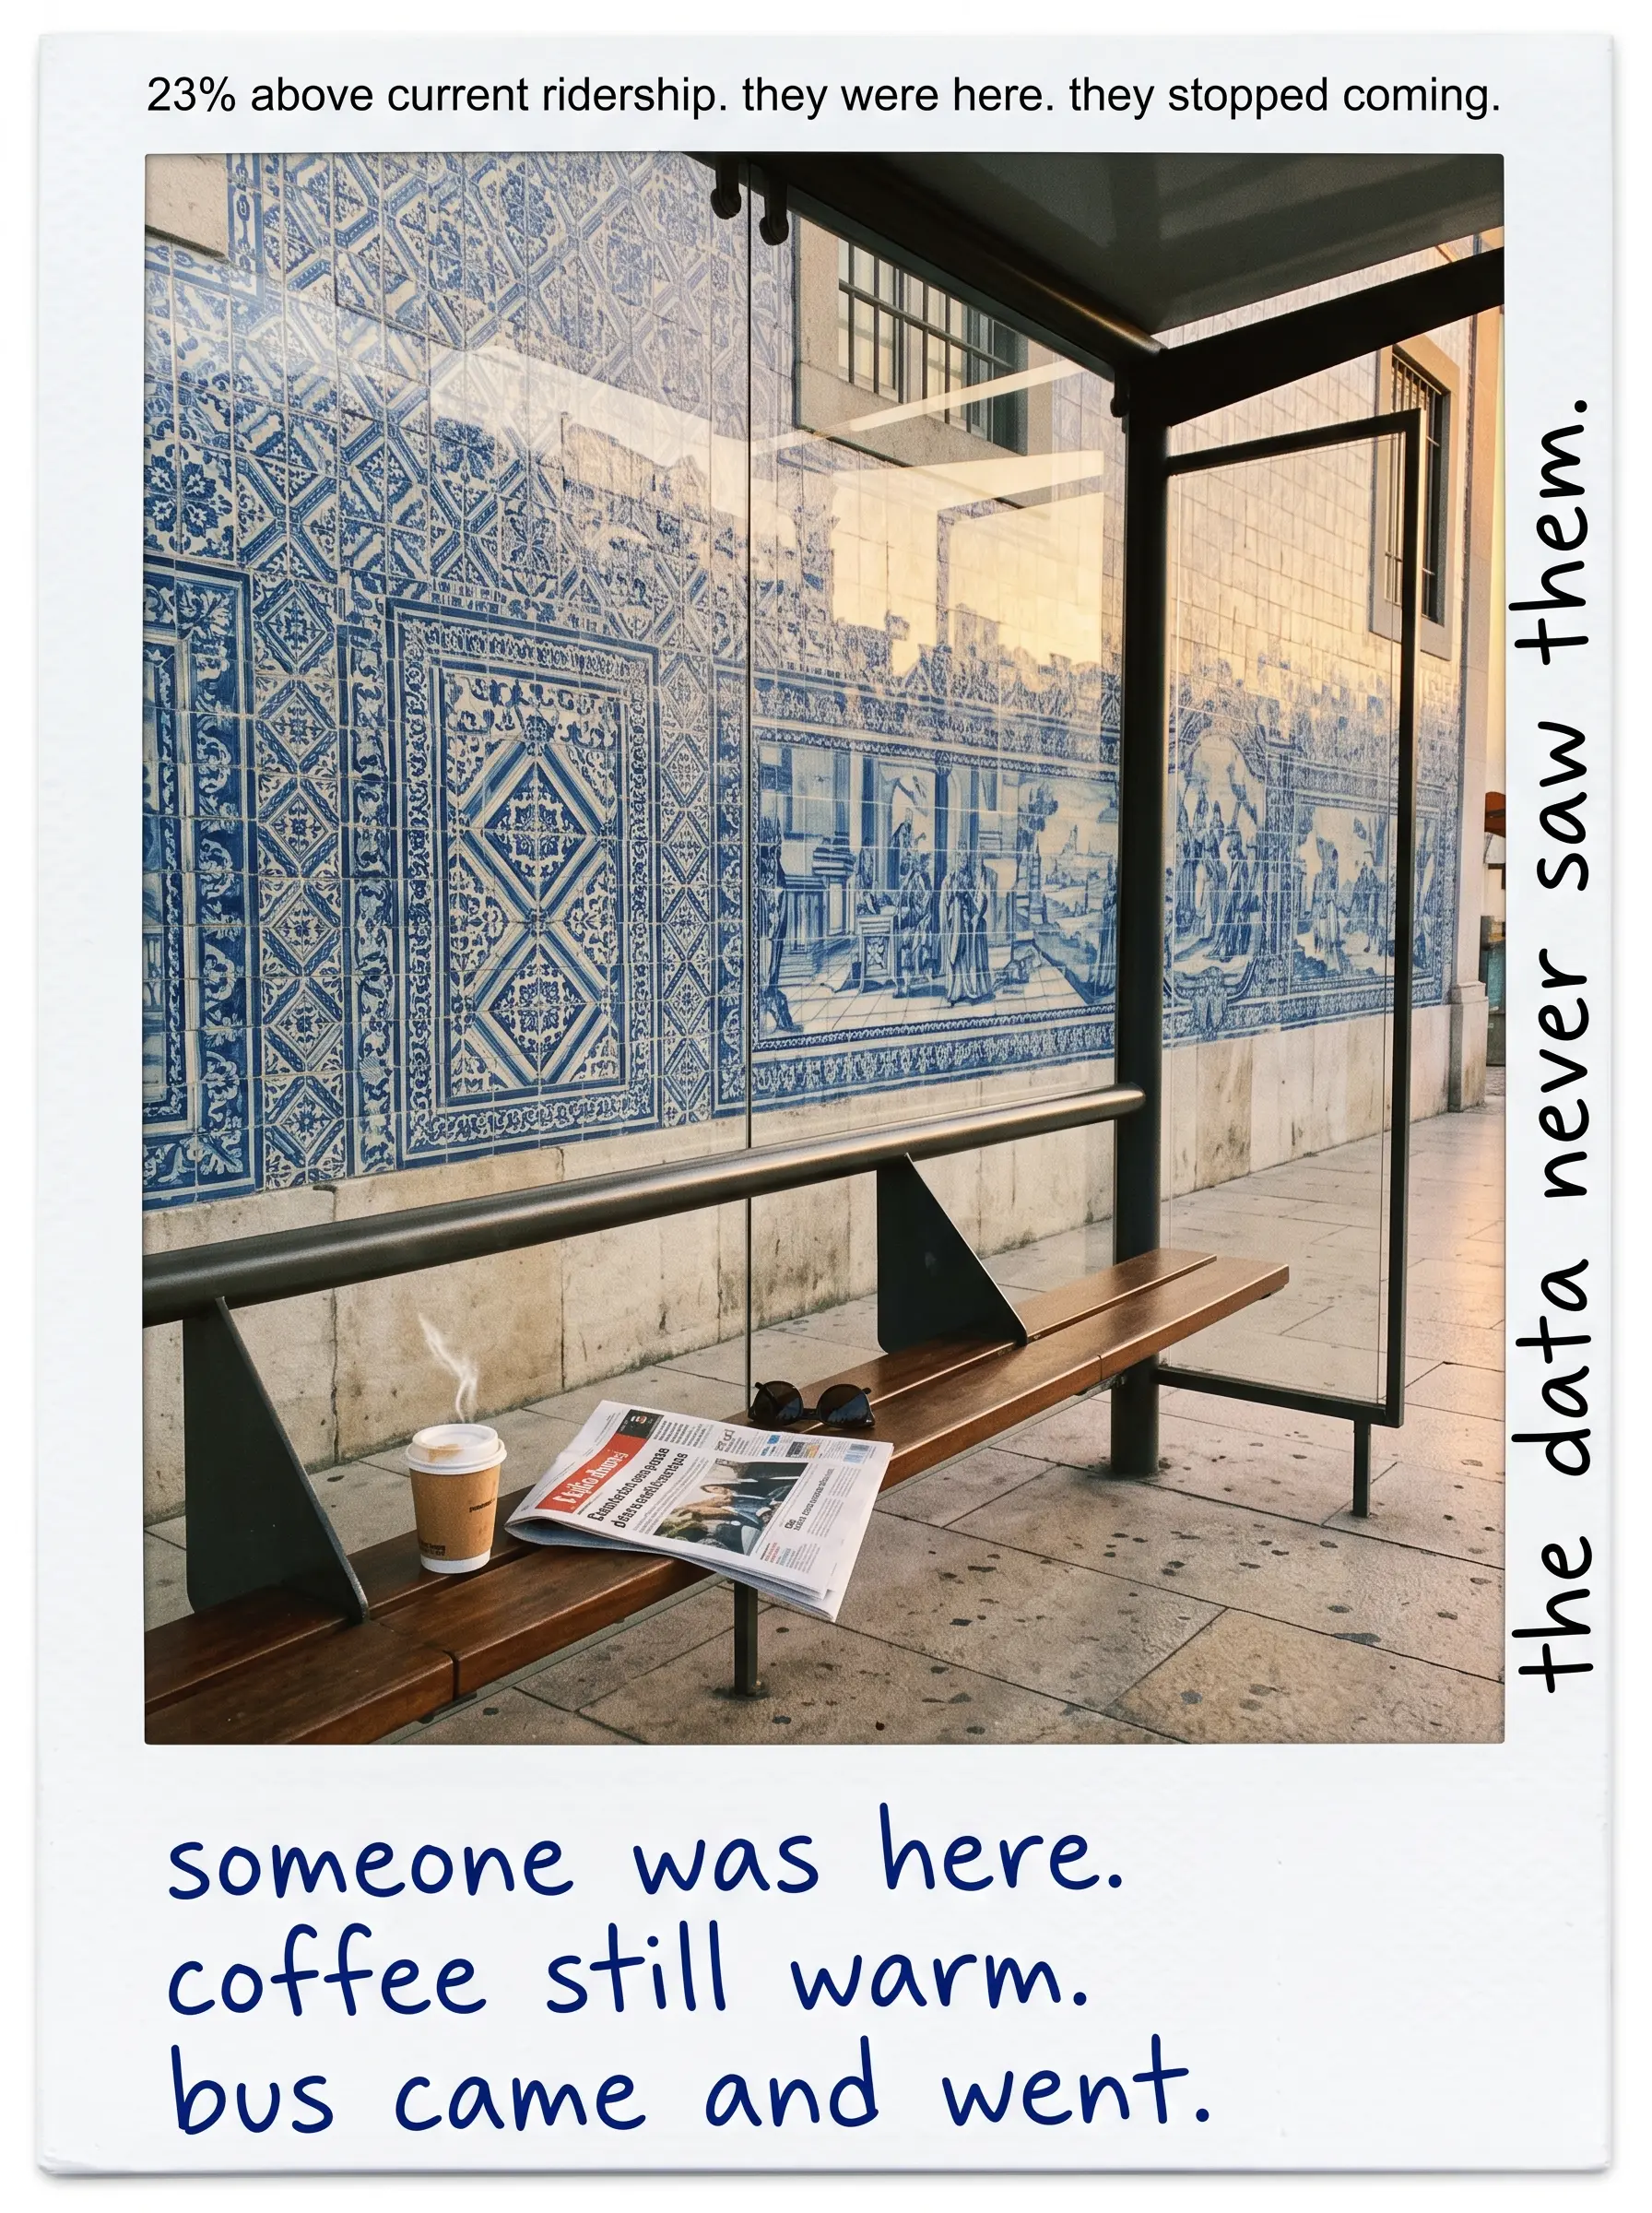
- Group 3 — "I didn't know it existed": Routes exist. Stops exist. Services run. This person had simply never encountered information about them. Zero visibility. 19%.
These three groups combined represented 74% of the existing ridership base. The system was missing nearly half its potential passengers — not because they didn't want transit, but because the system had never made itself visible or accessible to them.
Abu Dhabi's response was structural: a zero-based demand mapping exercise, new feeder routes to high-latent-demand zones, stop repositioning based on walkability analysis, and a visibility campaign targeting non-users.
Result: 34% ridership increase in 18 months.
The culture didn't change. The climate didn't change. The system did.
Measuring What You Can't See: Three Methods
Quantifying latent and denied demand requires moving beyond standard ridership data. Three approaches work in practice:
1. Exit Survey Methodology
Immediate intercept interviews with passengers who arrived at stops but could not board: "Where were you going? What will you do now?" This produces direct denied passenger data. It is not expensive — but it requires systematic deployment across multiple observation points over time.
2. Passive Signal Analysis
Mobile device location data, social media complaint streams, call center records, and web search trends — searches for "transit + neighborhood name" are a strong proxy for latent demand in underserved areas. The passenger may not be speaking to the system. But their phone is.
3. Counterfactual Demand Modeling
"If frequency on this route doubled, how many additional passengers would board?" This question can be answered through regression analysis of comparable routes where frequency changes have already occurred. Econometrically demanding — but the most powerful method for estimating demand that has never existed.
What all three approaches share: they ask about people who are not currently in the data. They make the invisible visible.
The Planning Connection: Why This Changes Everything
Every planning decision made without latent demand data carries the same risk: giving the right answer to the wrong question.
"Why is this route underperforming?" Standard answer: "Low demand." Correct answer, more often than the industry acknowledges: "Demand exists but the system is suppressing it."
The difference is not semantic. It is operational.
When a route is cut because of "low demand," the latent demand it was failing to serve goes further underground. The people who had stopped trying stop thinking about it entirely. The system's self-reported performance improves — fewer routes, fewer costs, better utilization ratios — while the actual population it serves shrinks.
Planning decisions grounded in data must also be grounded in an honest accounting of what that data cannot see.
Observed ridership tells you: How the system is performing today.
Denied passenger data tells you: What the system could become.
Without the second, the first is incomplete. And planning built on incomplete data does not transform cities. At best, it maintains them.
Where OW Enters the Picture
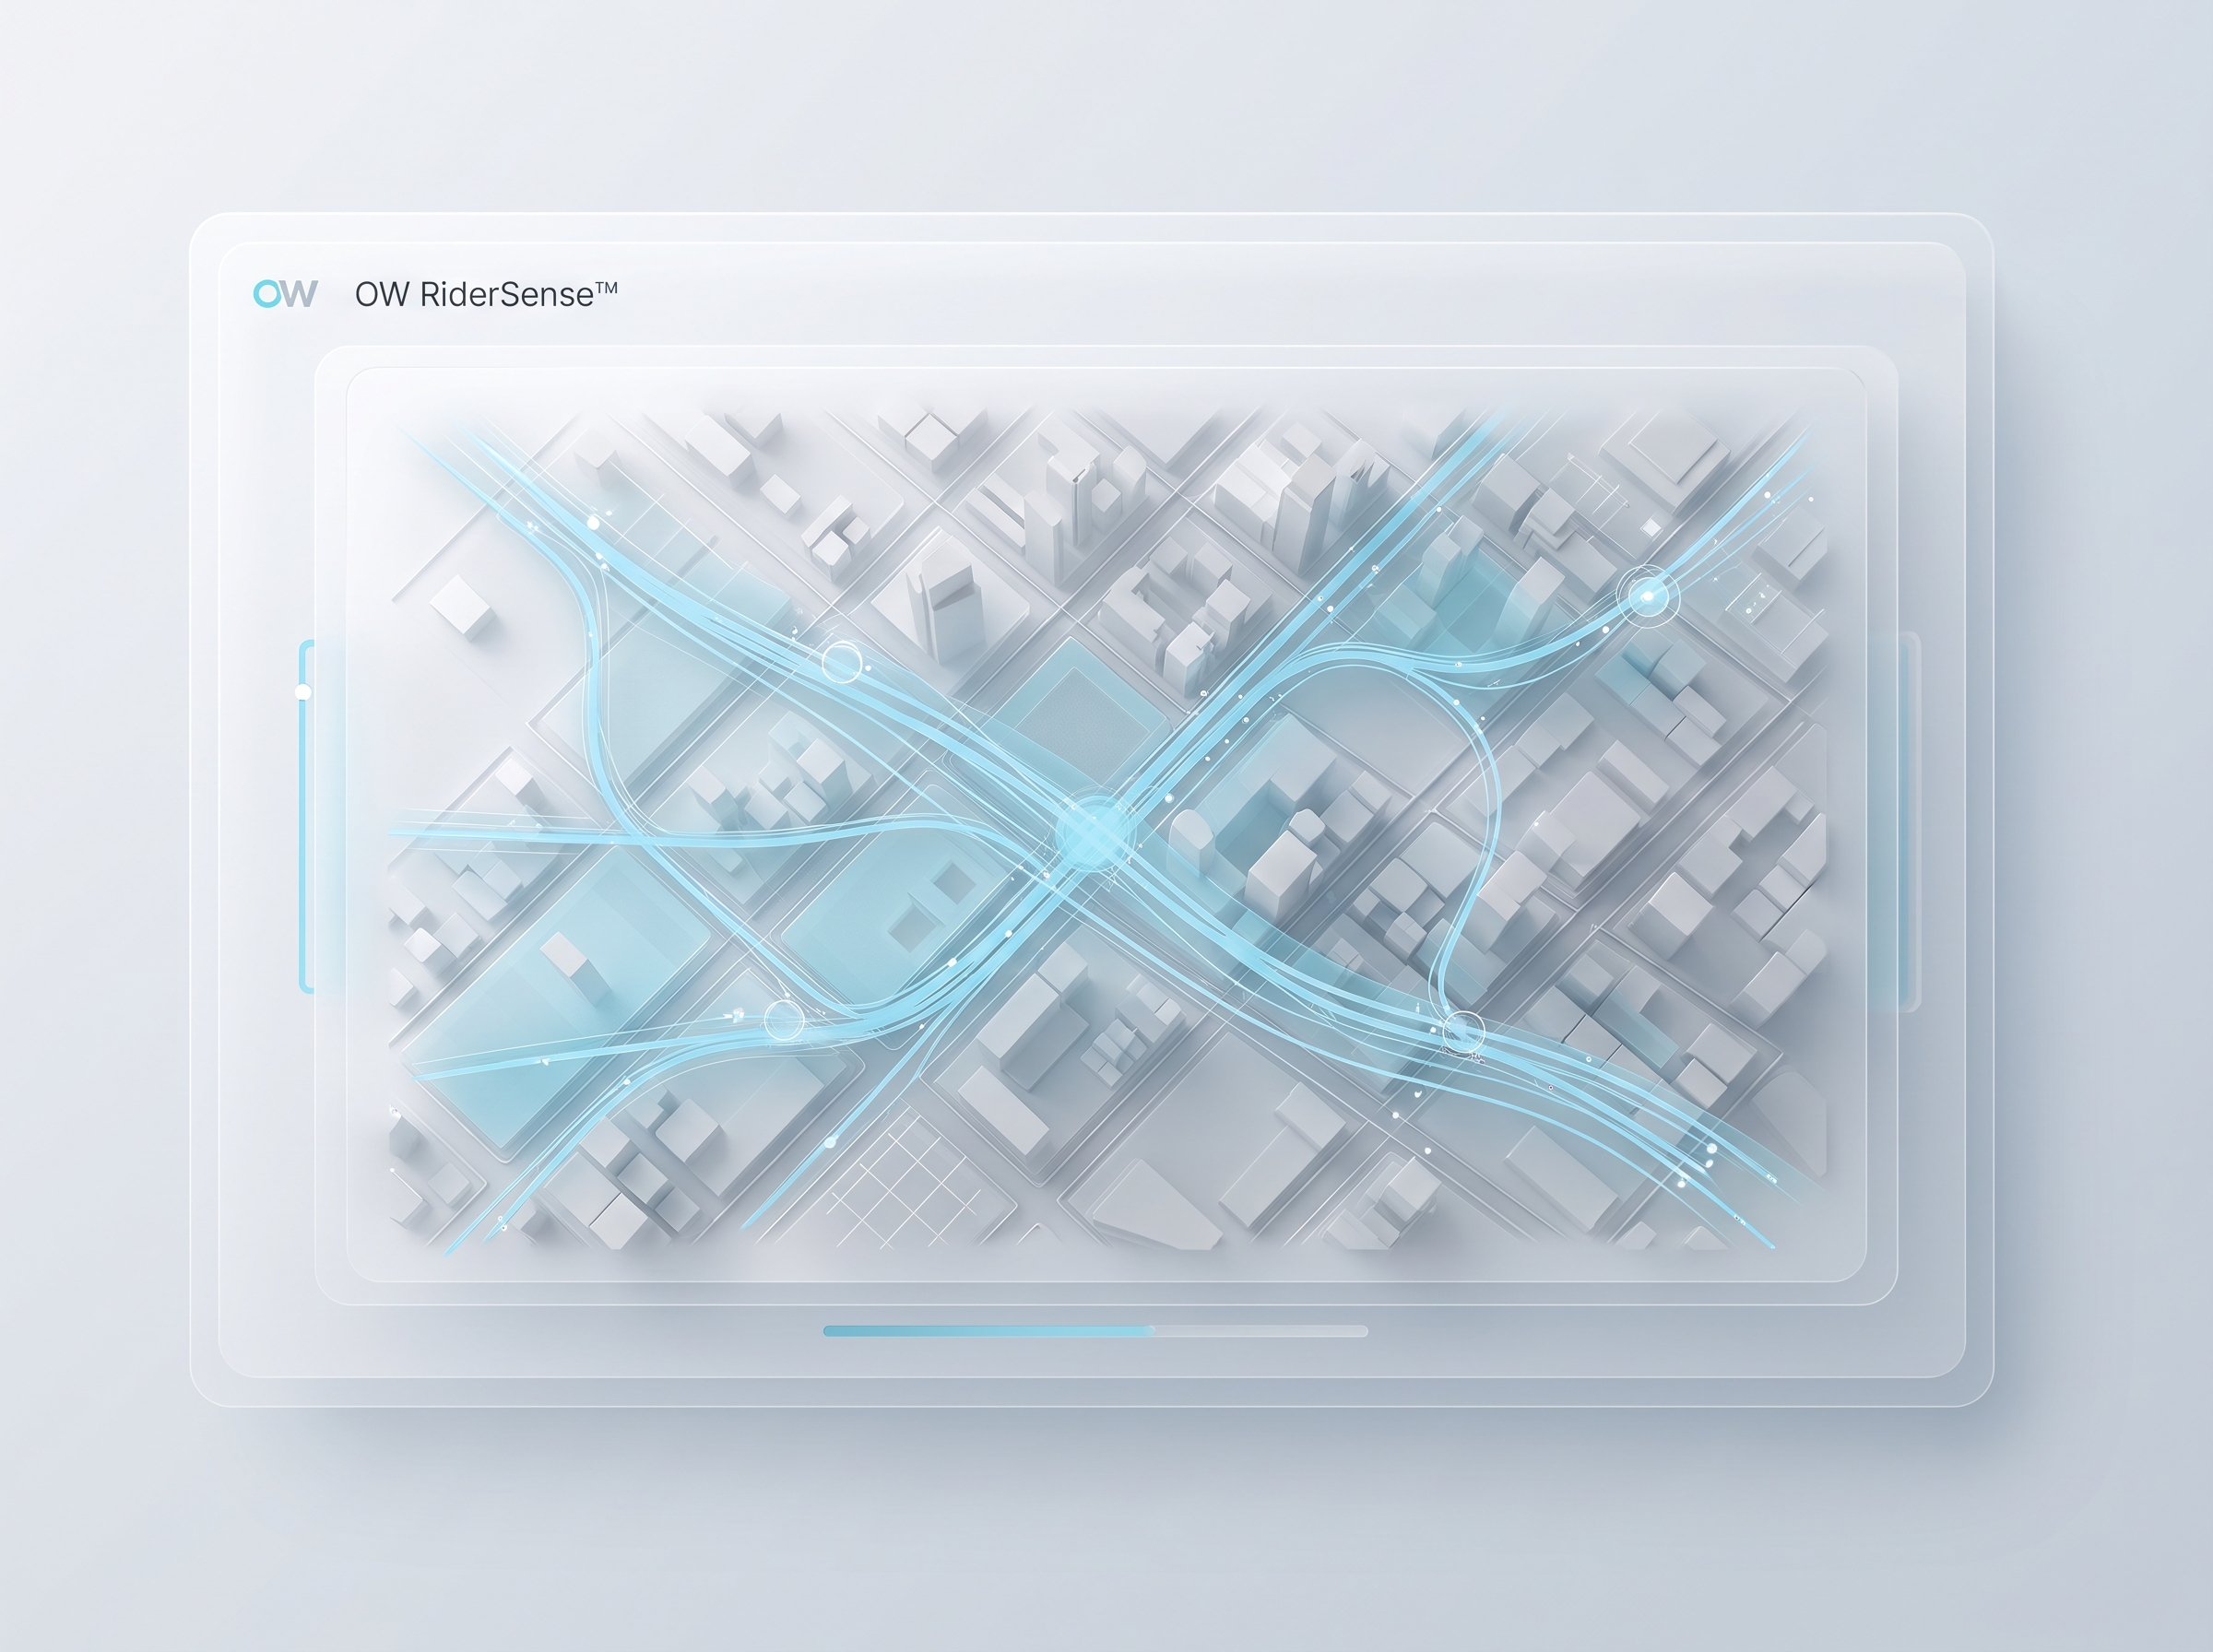
OW RiderSense™ analyzes passenger demand signals across multiple data layers — fare card records, GPS traces, complaint streams, and passive mobility data — to build a picture of where demand exists but is not being served. The output is not a ridership report. It is a map of invisible passengers: where they are, when they appear, and what is preventing them from boarding.
OW FreqOpt™ translates that demand map into scheduling decisions. Routes with high latent demand receive frequency increases calibrated to draw suppressed ridership into the system. Load profiles rebalance. Ridership grows — on the same fleet, within the same budget.
The goal is not optimization as an abstract exercise. It is seeing what the system currently cannot see — and building for the city that exists, not just the one that shows up in the data.
Conclusion: The City You Can't See Is the City You Can't Serve
The woman in Eskişehir was late to her interview. The commuter in Lisbon kept the car. The worker in Abu Dhabi kept paying for taxis.
None of them appeared in the system's data.
All of them were counted as "low demand."
All of them were real.
Transit capacity is not measured by the passengers a system carries today. It is measured by the passengers it could carry — and the gap between those two numbers is where most cities are losing.
Closing that gap begins with a decision to look for people the data has never shown you.
The passenger who never boarded is still out there.
They are still waiting.
They just stopped going to the stop.
👉 Free Operational Efficiency Pre-Assessment — Let's review latent demand and frequency alignment together.
👉 15-Minute Consultation — Let's discuss your city's denied passenger profile.
Resources and Further Reading
- Lisbon Metropolitan Area Transport Authority — Latent Demand Study: Understanding Non-Users (2019)
- Abu Dhabi Department of Transport — Public Transit Demand Assessment (2021)
- Victoria Transport Policy Institute — Transit Ridership and Latent Demand
- Ceder, A. — Public Transit Planning and Operation (2nd Ed.)
- OW RiderSense™ — Demand Analytics and Passenger Behavior
- OW FreqOpt™ — Frequency and Headway Optimization
Frequently Asked Questions (FAQ)
What is a denied passenger?
Anyone who cannot board due to capacity, or who stops trying because the system is unreliable or inaccessible. Latent demand belongs to the same family of invisible demand that standard ridership counts miss.
Why does observed ridership mislead planners?
It only counts people who board. Suppressed or never-formed demand is absent from the dataset, so “low demand” often hides service that is suppressing demand.
Can ridership grow without buying new buses?
Yes. Lisbon grew ridership ~18% in two years through frequency and transfer simplification; Abu Dhabi saw ~34% growth in 18 months after latent-demand interventions — same-fleet logic.
Related Modules
Used in this piece

Related Posts
Continue with adjacent topics—from mixed-integer programming (MIP) and combinatorial optimization to multi-objective scenario modeling in public transit.

Why Is It So Difficult to Keep Everyone Happy in Public Transport?
Passenger demand and limited operational resources share the same network. The real challenge is not more buses — it is aligning supply with how people actually travel.
Buying Electric Buses Is Easy. Operating Them Optimally Is the Hard Part.
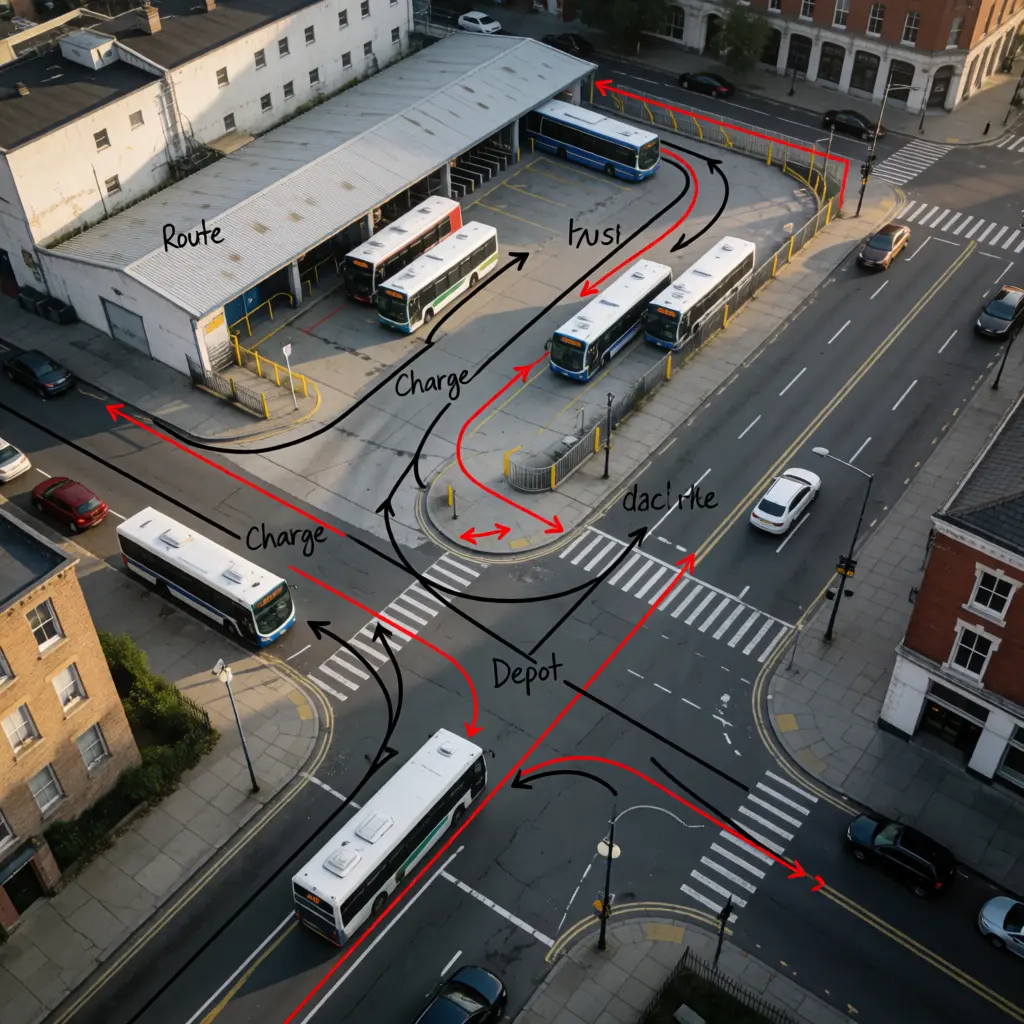
Electrification does not end at procurement. Vehicle assignment, charging schedules and energy constraints must be optimized together — or costs rise quietly every day.