12 min read
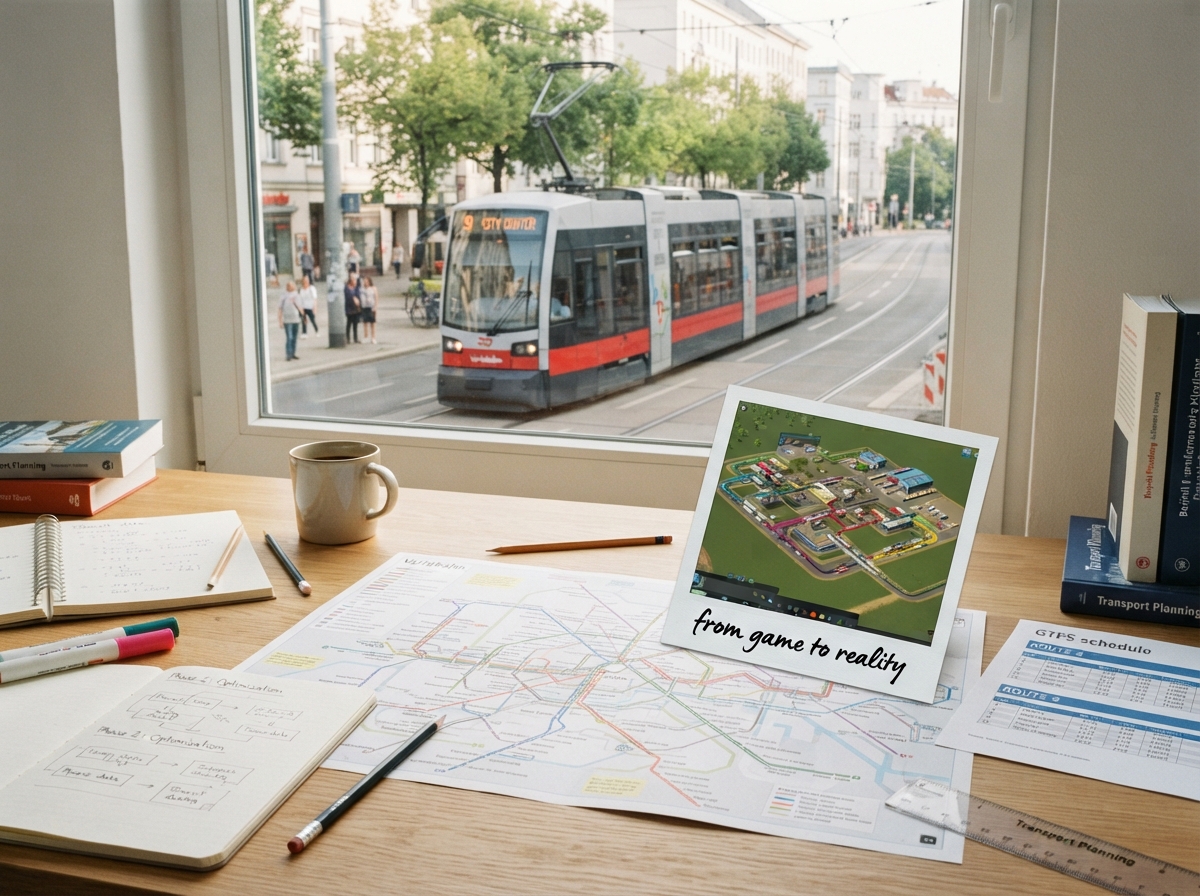
How to Build a Public Transport Network in Strategy Games? Real-World Optimization

Written by Dr. Ümit Kuvvetli
Founder & Chief Optimization Scientist
Published: April 2026 · Reading time: ~12 minutes
Why Does Traffic Collapse in Games?
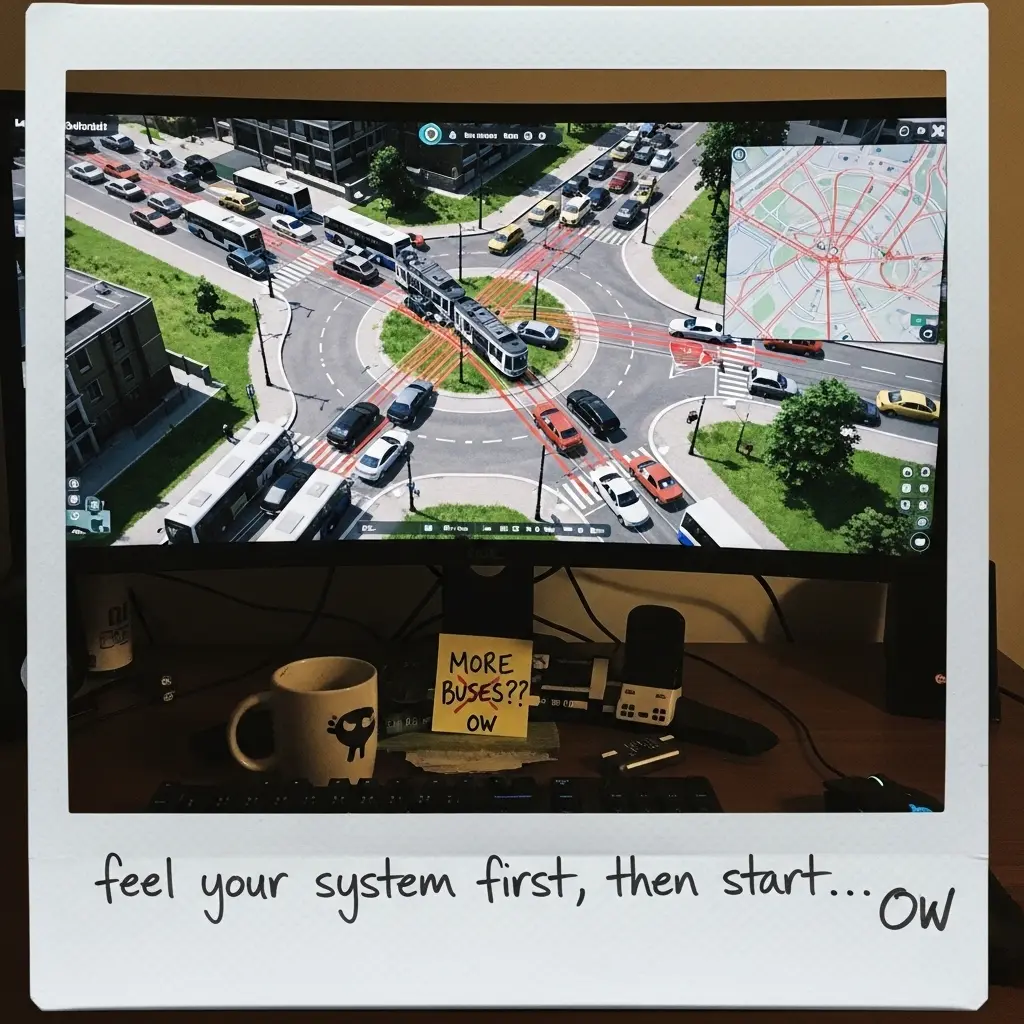
Everything was going well. Your city was growing, buildings rose, and tax revenue climbed. Then one morning you load in and every road is red.
Anyone who has played Cities: Skylines, Transport Fever 2, or Workers & Resources knows this moment. And nearly everyone makes the same mistake: add more buses. Then another. Then another. Traffic does not get better; it often gets worse.
The reason is simple: transit is not a vehicle problem, it is a system problem. Adding vehicles does not fix structure—it masks it and often creates new bottlenecks.
Real-world planners internalized that decades ago. The twist: the simulation sandbox in games is a great lab to apply the same Decision Intelligence principles—turning data into decisions, not just more routes.
3 Key Differences Between Games and the Real World
1. Data quality
- In games: Perfect—the simulation knows everything.
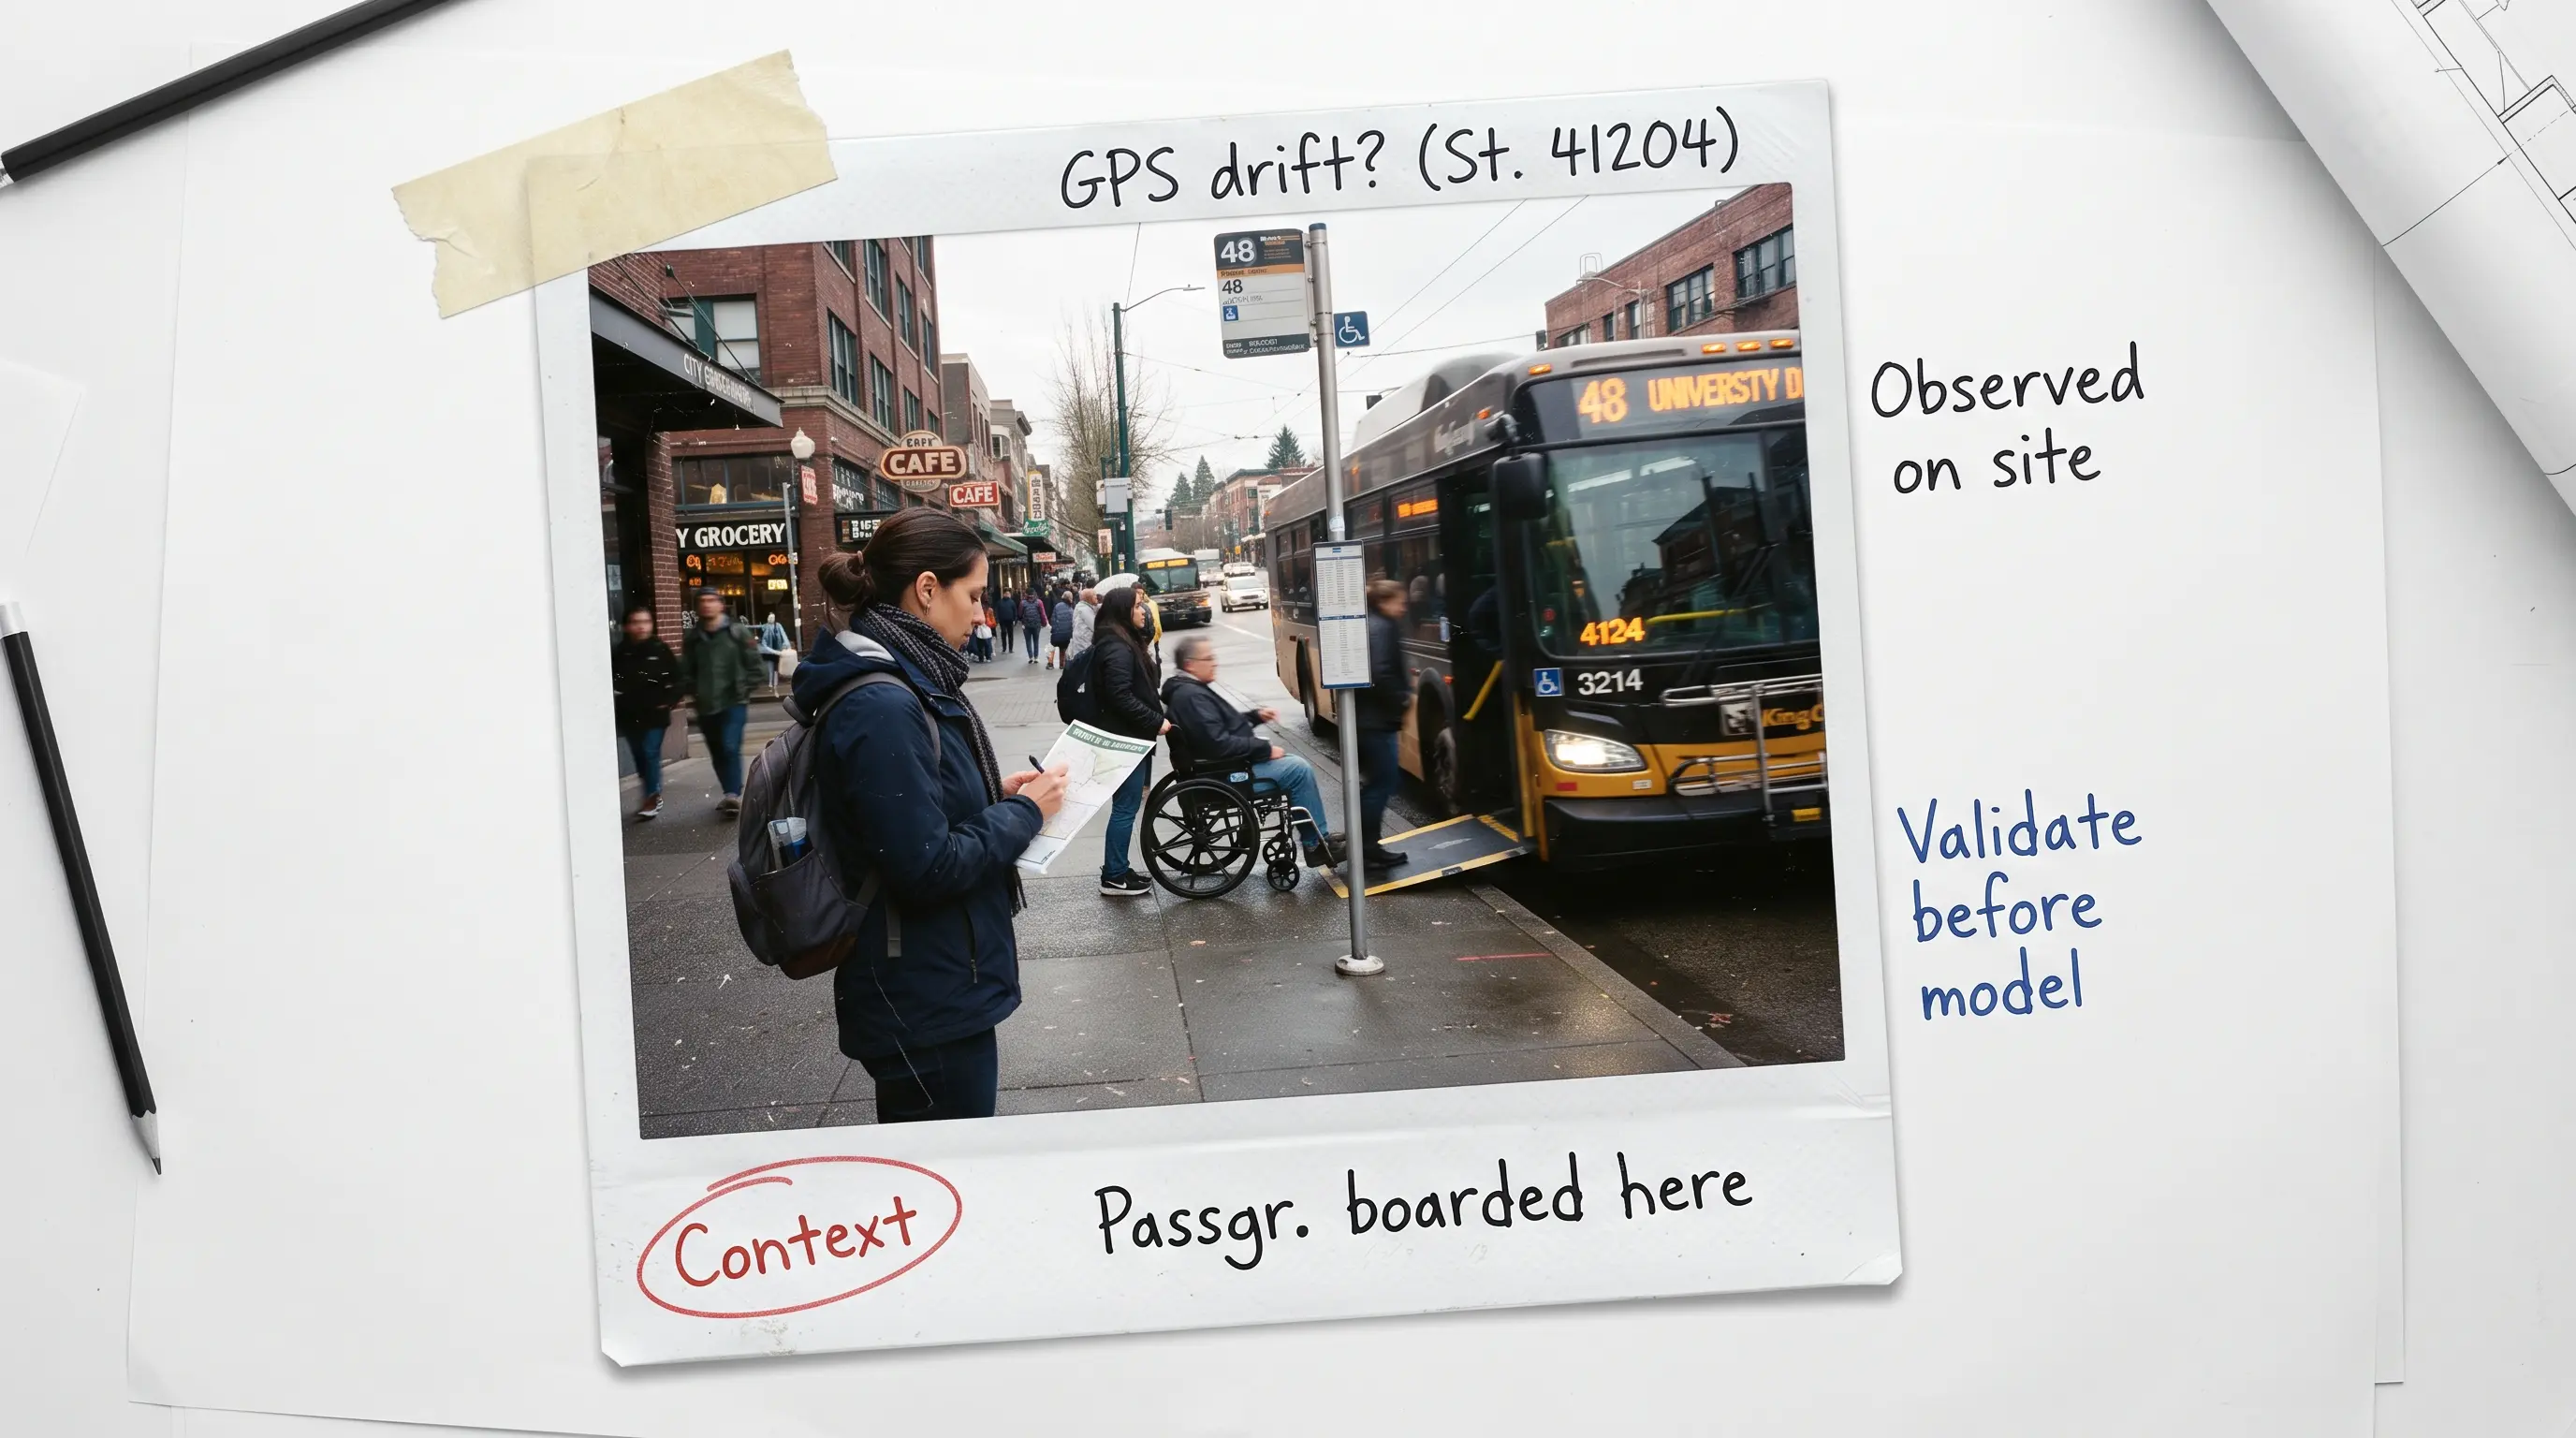
- In the real world: GTFS errors, bad timestamps, GPS drift; data quality is a core operations issue.
2. Dead mileage
- In games: Often invisible.
- In the real world: 15–30% of cost stack; the biggest hidden waste—Dead mileage (Boş kilometre) and non-revenue legs.
3. Headway optimization
- In most games: Fixed timetables.
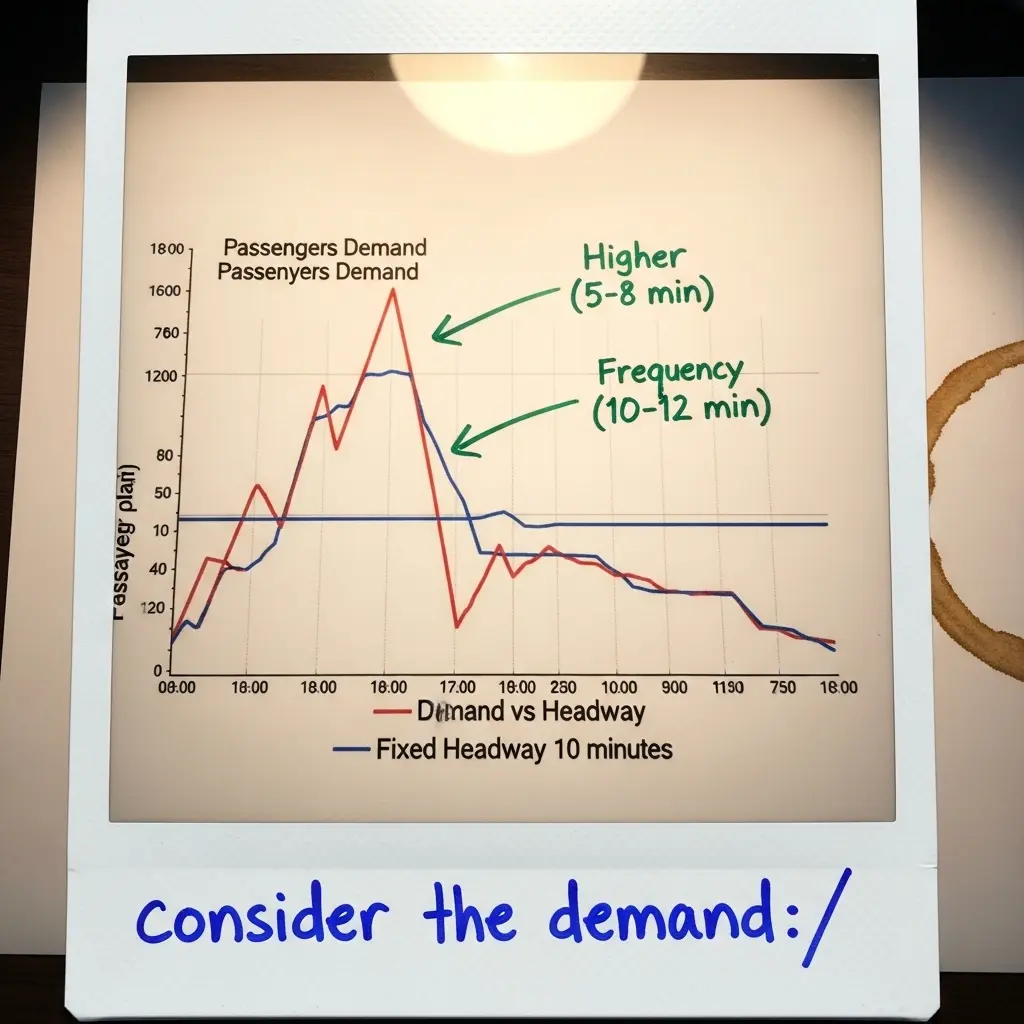
- In the real world: Headway targets shift by corridor, time of day, and demand.
Note: in reality many routing decisions are political, not technical—pressure that does not exist in games.
Field benchmark: per Transport for London (TfL) 2023 Bus Service Planning Guidelines, ideal headway is about 5–8 minutes in peaks and 10–12 minutes in off-peak. Going tighter raises quality but cost disproportionately; going wider nudges riders to private cars.
Source: TfL — Bus Service Planning Guidelines (2023)
Stage 1 — Build the Starter Network the Right Way
Bus or metro?
You are really asking: how do I add capacity the fastest?
In the real world the decision is heavier: a bus line can take months; metro can take decades and billions. Transport for London (TfL)-scale data suggests metro can be 40–50× the per-km cost of bus infrastructure for the same corridor—so subways are justified only when daily ridership crosses a high threshold (often ~20,000–30,000 per day on the corridor).
The same logic applies in games: metro "too early" strains your budget.
Rule of thumb: optimize the bus network up to your first ~50k population. Add metro when radial corridors choke—not before.
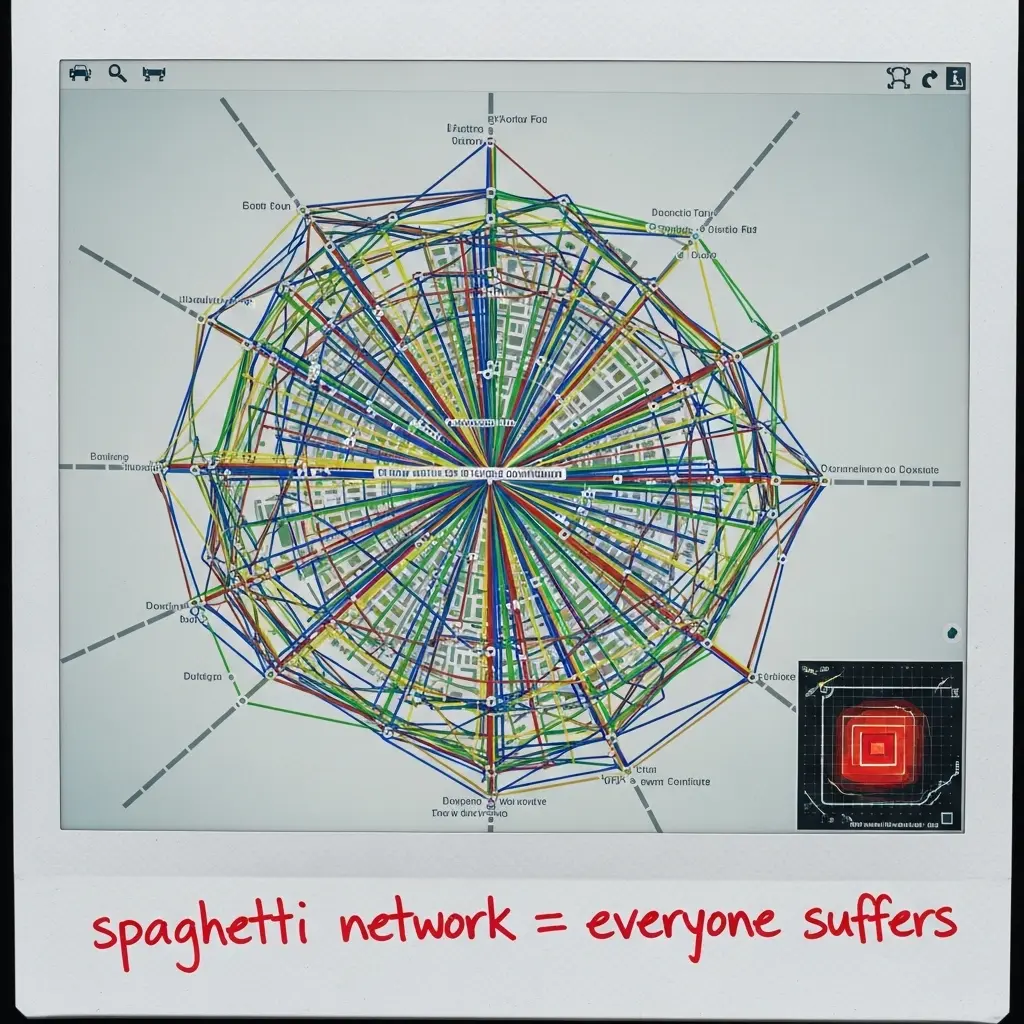
The "direct line from every neighborhood" mistake
It looks good on paper—everyone goes straight to the center. In practice you get under-filled lines, a congested core, parallel competing routes, and a network nobody can reason about. That is a "spaghetti network." Learn the cost of competing, overlapping lines.
Stage 2 — Strategies to Grow the Network
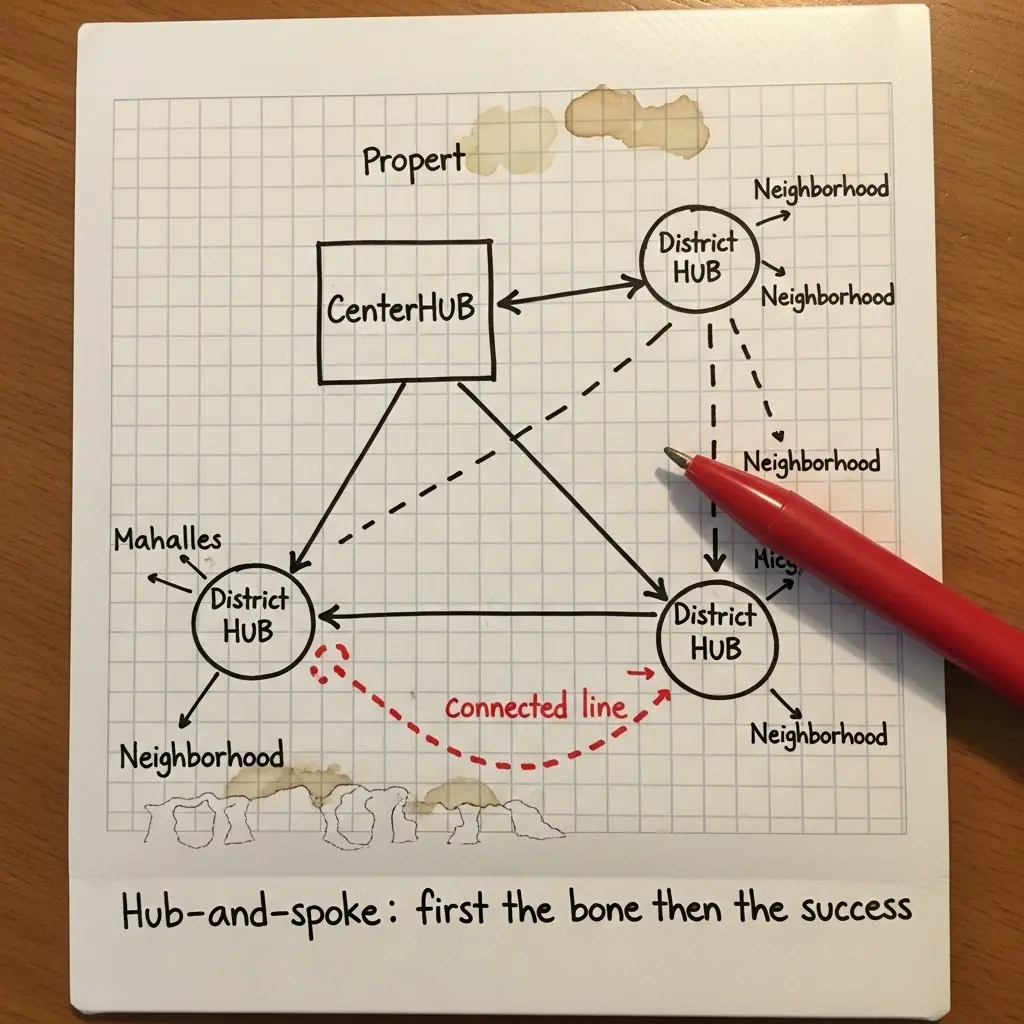
Hub-and-spoke: do not home-run everything to one point
Hub-and-spoke is one of the most effective design patterns. You create strong hub transfer points and spoke feeders instead of connecting every node to every other node.
The trap: if all spokes meet one pixel-perfect center, the core becomes a geographic and operations choke point. The fix is a hierarchy: city center hub, district hubs, neighborhood transfer points.
In Cities: Skylines: instead of one mega terminal, let each district have a small transfer hub, link metros between hubs, and let buses feed those hubs.
Ring / orbital lines
Many players draw only radial, center-seeking lines—but a lot of travel is peripheral-to-peripheral. Add ring (orbital) services for those markets.
Real-world pattern: the İzmir corridor of Karşıyaka–Alsancak–Konak–Üçyol, with heavy rail and metro as a backbone and hundreds of bus routes feeding it, is exactly this spine + feeder idea.
Stage 3 — Five Rules for a Smooth, High-Quality Network

1. Keep headways within TfL-style bands in-game
Transport for London (TfL) research aligns with peak headway targets around 5–8 minutes and off-peak 10–12 minutes. When waits exceed ~10 minutes, the trip "feels expensive" to riders. Sub-8 minute headways can feel "turn-up-and-go" for frequent users.
In games, when a line's headway drifts past ~10 minutes, you often see crowding at stops—that is your service gap signal.
2. Keep transfer walk under ~250m
Riders accept roughly 250–300m of walking between stops for a transfer. Beyond that, the transfer feels like punishment and mode shift follows.
In-game, place stop clusters deliberately—two "linked" platforms far apart is an integrated system on paper but broken in practice.
3. Depot siting must minimize Dead mileage (Boş kilometre)
Before revenue service, vehicles deadhead from the depot to the first stop and back—Dead mileage (Boş kilometre). In the field, it can be 15–30% of cost.
Games under-price this, but you can still play realistically: place depots near the center of mass of early-morning pull-outs.
4. Add peak capacity for the bell curve, not a flat line
Peaks (07:30–09:00 and 17:00–19:00) can be 3–4× the rest of the day. A flat all-day headway both starves the peak and wastes midday.
Decision Intelligence in real operations automates that cadence. In games, tune lines manually if you can—it teaches the same muscle memory.
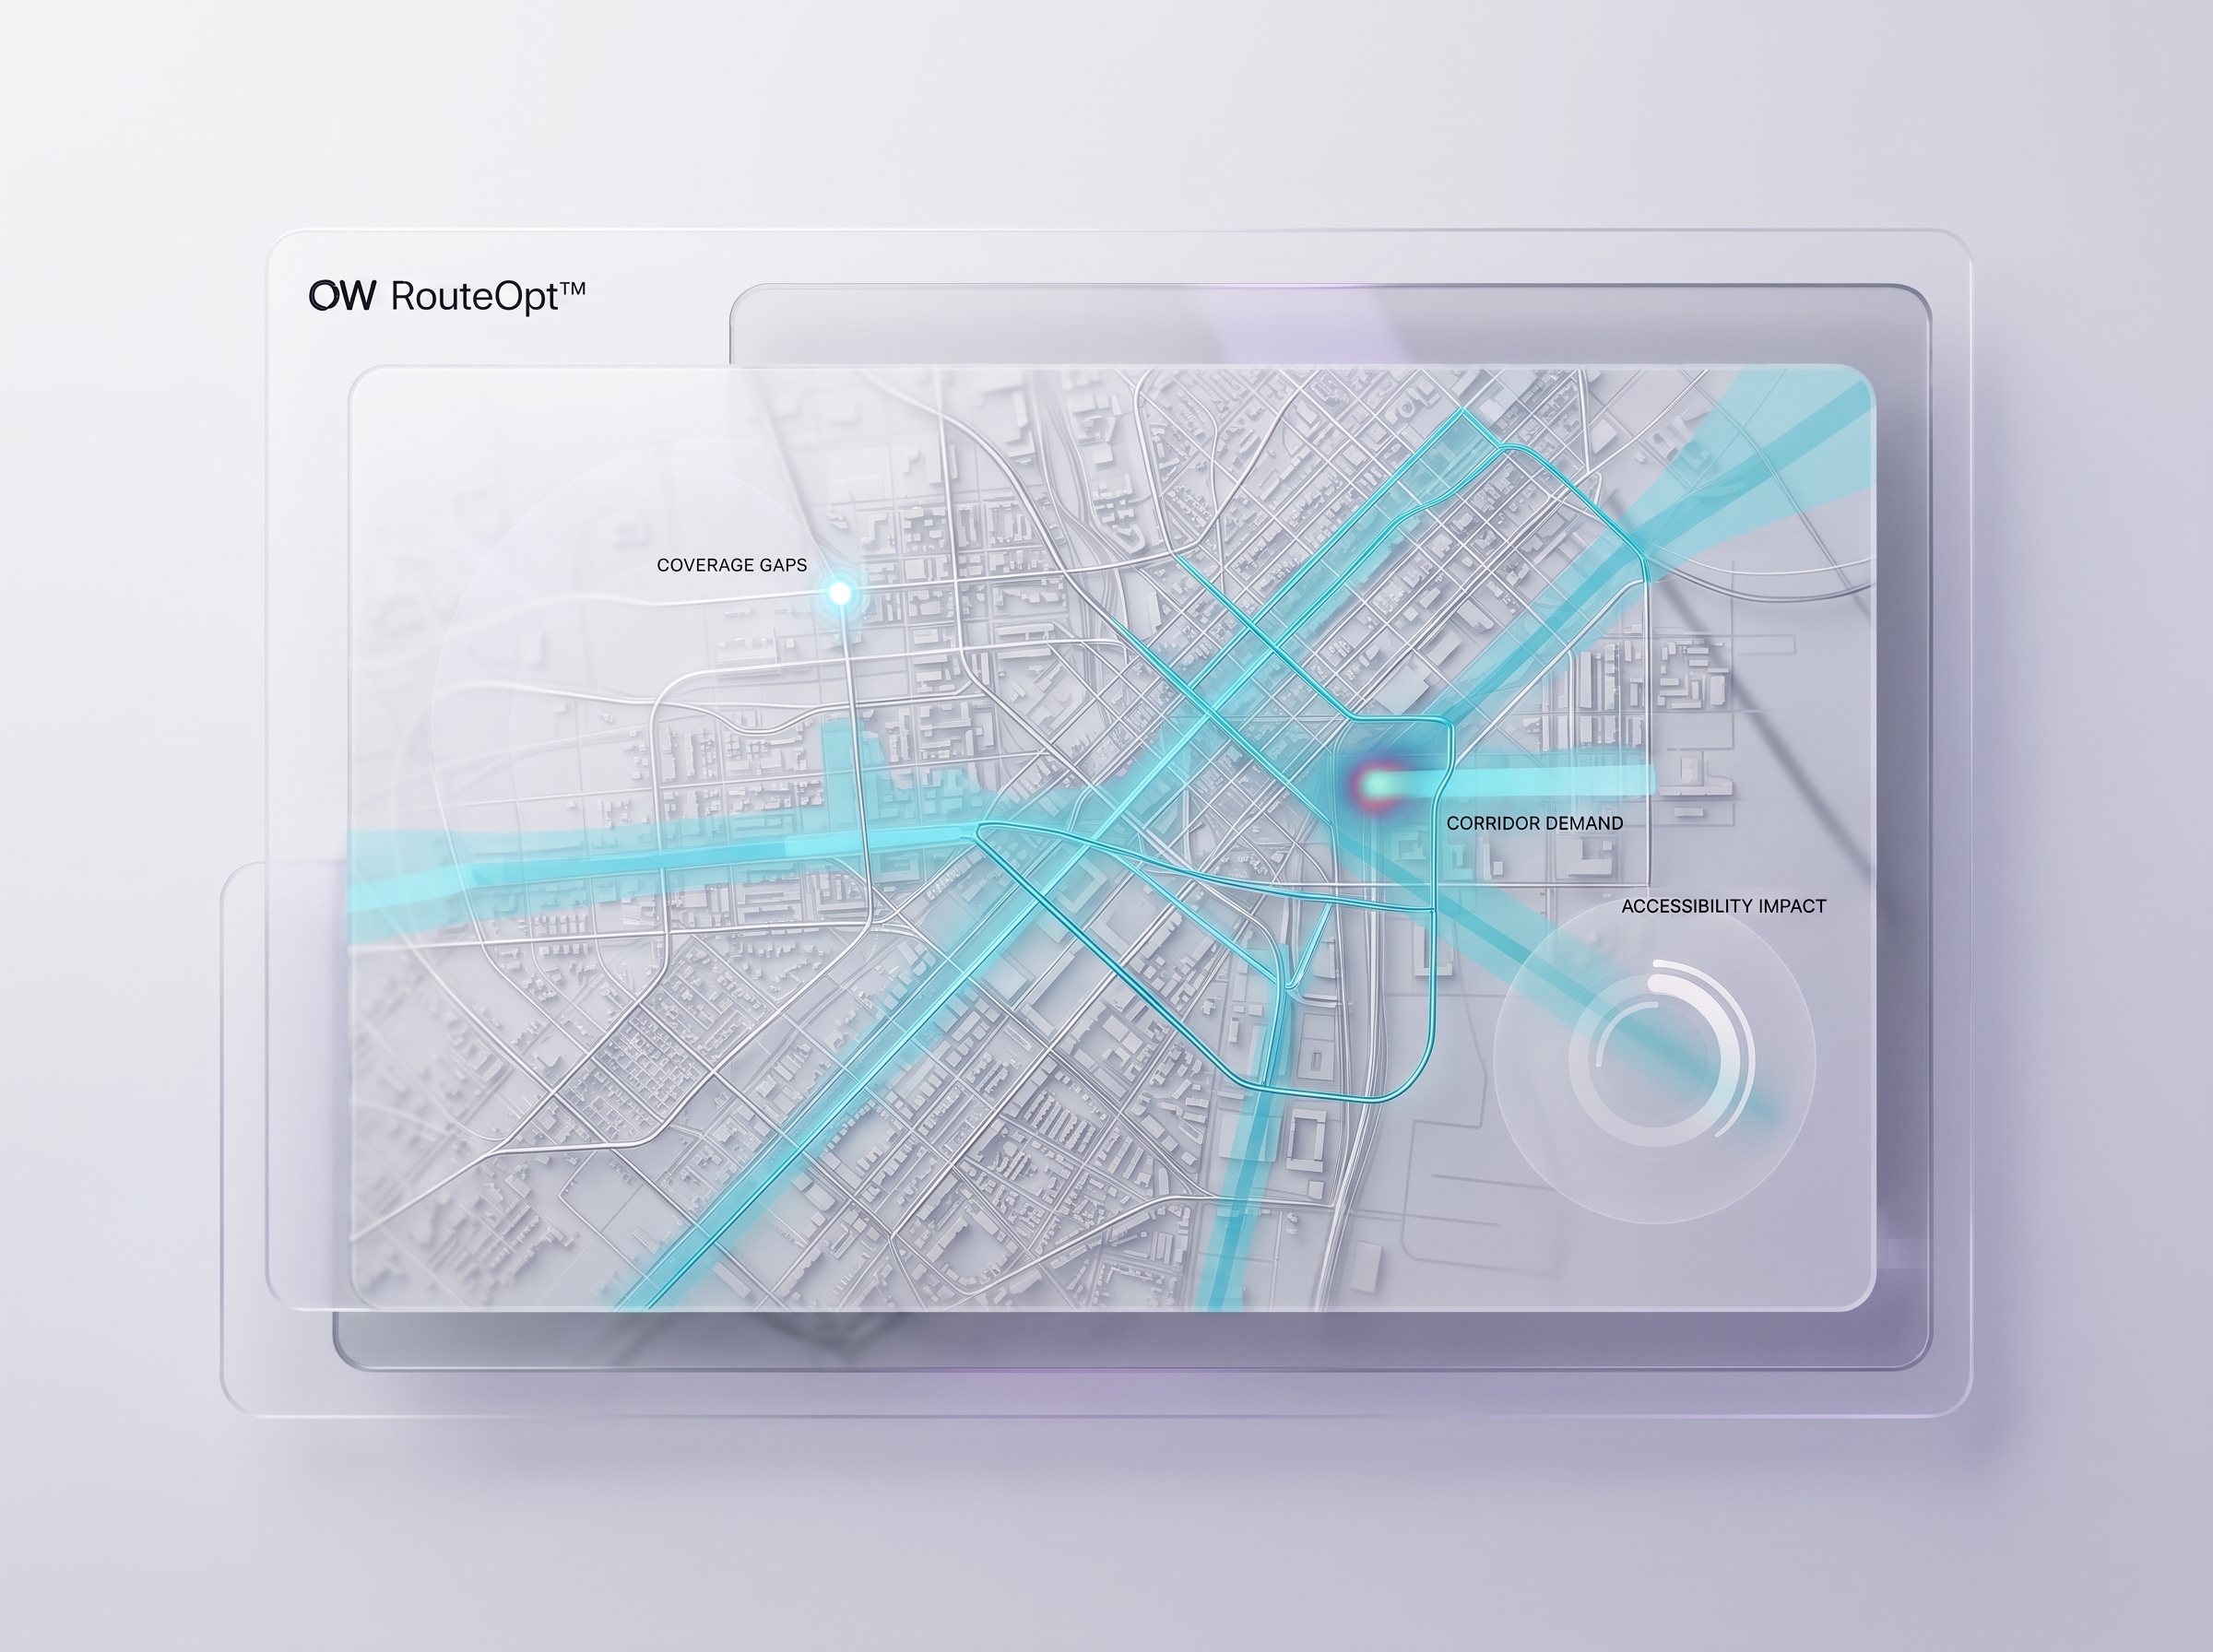
5. Read the dashboards—do not "vibes-plan"
Cities: Skylines traffic view, W&R flow widgets, or Transport Fever line load charts are systems telemetry. The real world has GTFS, AVL logs, and smartcard timestamps—most agencies barely scratch the surface, leaving 10–30% efficiency on the table.
If a bus line in Cities: Skylines sits at >120% load, add vehicle capacity or headway. If it is <30%, cut or merge the line. Those calls are data calls.
Stage 4 — How Real-World Mess Shows Up in Games
Dead mileage (Boş kilometre) is still invisible in most games
There is no modal warning for depot-to-first-stop or last-stop-to-depot distance—but the financial damage is very real in cities. Track how far vehicles run without passengers; if a bus deadheads from across the map, your depot or line structure is wrong.
Data is perfect in games—not in the GTFS world
A game can show per-stop loads and per-line boardings perfectly. The field lives with GTFS quality problems—wrong stop coordinates, missing trips, GPS gaps. Cleaning feeds is a prerequisite to optimization.
Politics: the one simulator games skip
In games you draw the "right" line and implement it. In reality, alignment politics defines service. Knowing this explains why the "best" math rarely ships unchanged—the winning design is technically sound, politically workable, and operationally sustainable.
FAQ (article body)
Which game models transit most faithfully?
Transport Fever 2 is a frequent planner reference for trip building and line economics. Cities: Skylines shines at the whole-city integration layer. W&R can be surprisingly good on depots and Dead mileage (Boş kilometre).
What is a "good" traffic percentage in Cities: Skylines?
Aim to stay under ~85% network-wide. 85–90% is stress; >90% is structural—more vehicles alone will not fix it.
Metro vs tram—"which is more efficient?"
Wrong question—ask which system for which demand level. Trams often fit up to a few thousand pphpd; high-capacity metro generally wants >15,000 pphpd on the corridor. BRT can bridge the middle.
Are there real firms in transit optimization?
Yes—GTFS analytics, headway design, and Dead mileage (Boş kilometre) reduction are active practice areas. See OW solutions for a productized path.
Resources
External:
- Transport for London — bus planning guidance
- UITP — international transit statistics and frameworks
Optimize the World Blog:
- GTFS data quality: the foundation of operational decisions
- Empty kilometers: the biggest hidden cost in transit
- Competing lines: a hidden source of waste
- OW solutions
Related Modules
Used in this piece

Related Posts
Continue with adjacent topics—from mixed-integer programming (MIP) and combinatorial optimization to multi-objective scenario modeling in public transit.
Garbage In, Optimized Out? Why Trusted Operational Data Matters More Than Big Data
Cities already have the data. The real question is which evidence deserves to be trusted before optimization, AI, or digital twins begin.
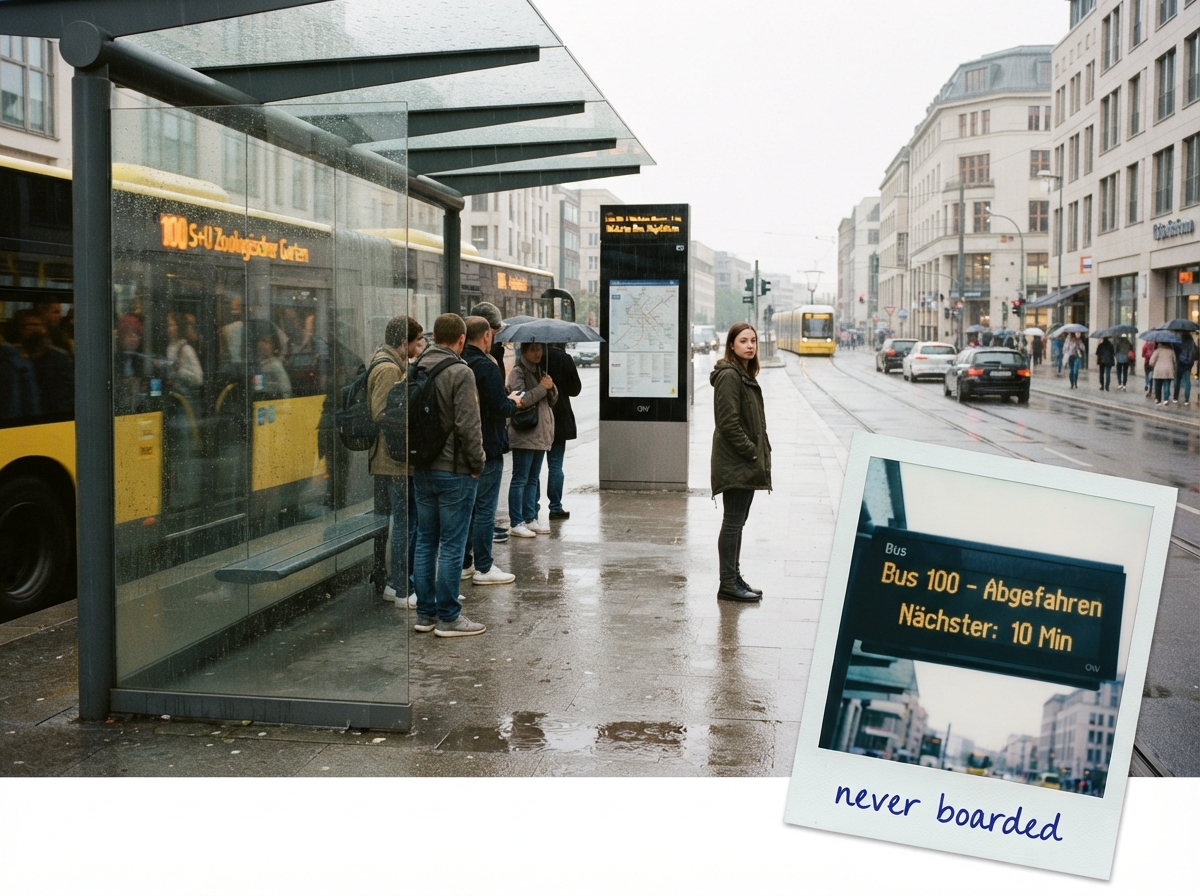
The Passenger Who Never Boarded: Transit Planning's Invisible Problem
Denied passengers and latent demand: why non-boarders never appear in ridership data. Lessons from Eskişehir, Lisbon, and Abu Dhabi on measuring real transit demand.