UNDERSTAND
Start with how the system actually works.
People and constraints before models.

ABOUT OW
Why do cities that have the data still make the wrong decisions?
Most transit agencies are drowning in data— but starving for understanding.
And yet, every budget cycle asks the same questions:
OW transforms operational complexity into better decisions.

01
We are not a reporting tool.
Reports explain yesterday. OW helps organizations decide what to do next.
02
We are not a black box.
Every recommendation can be traced to its assumptions, constraints, and optimization logic.
03
We are not replacing planners.
We are giving planners decision-grade tools.
Transit systems fail quietly — not from a lack of data, but from decisions made without seeing how the whole system behaves under real constraints.
Spreadsheets and dashboards describe the past. They rarely test the next move before it hits the street.
OW closes that gap: models that reflect operations, scenarios that expose trade-offs, and recommendations that can be audited.
Decision Intelligence turns operational signals into choices that hold on the street.
Operational Data
Understanding
Decision Intelligence
Optimization
Deployment
Measured Outcomes
CONTINUOUS LEARNING
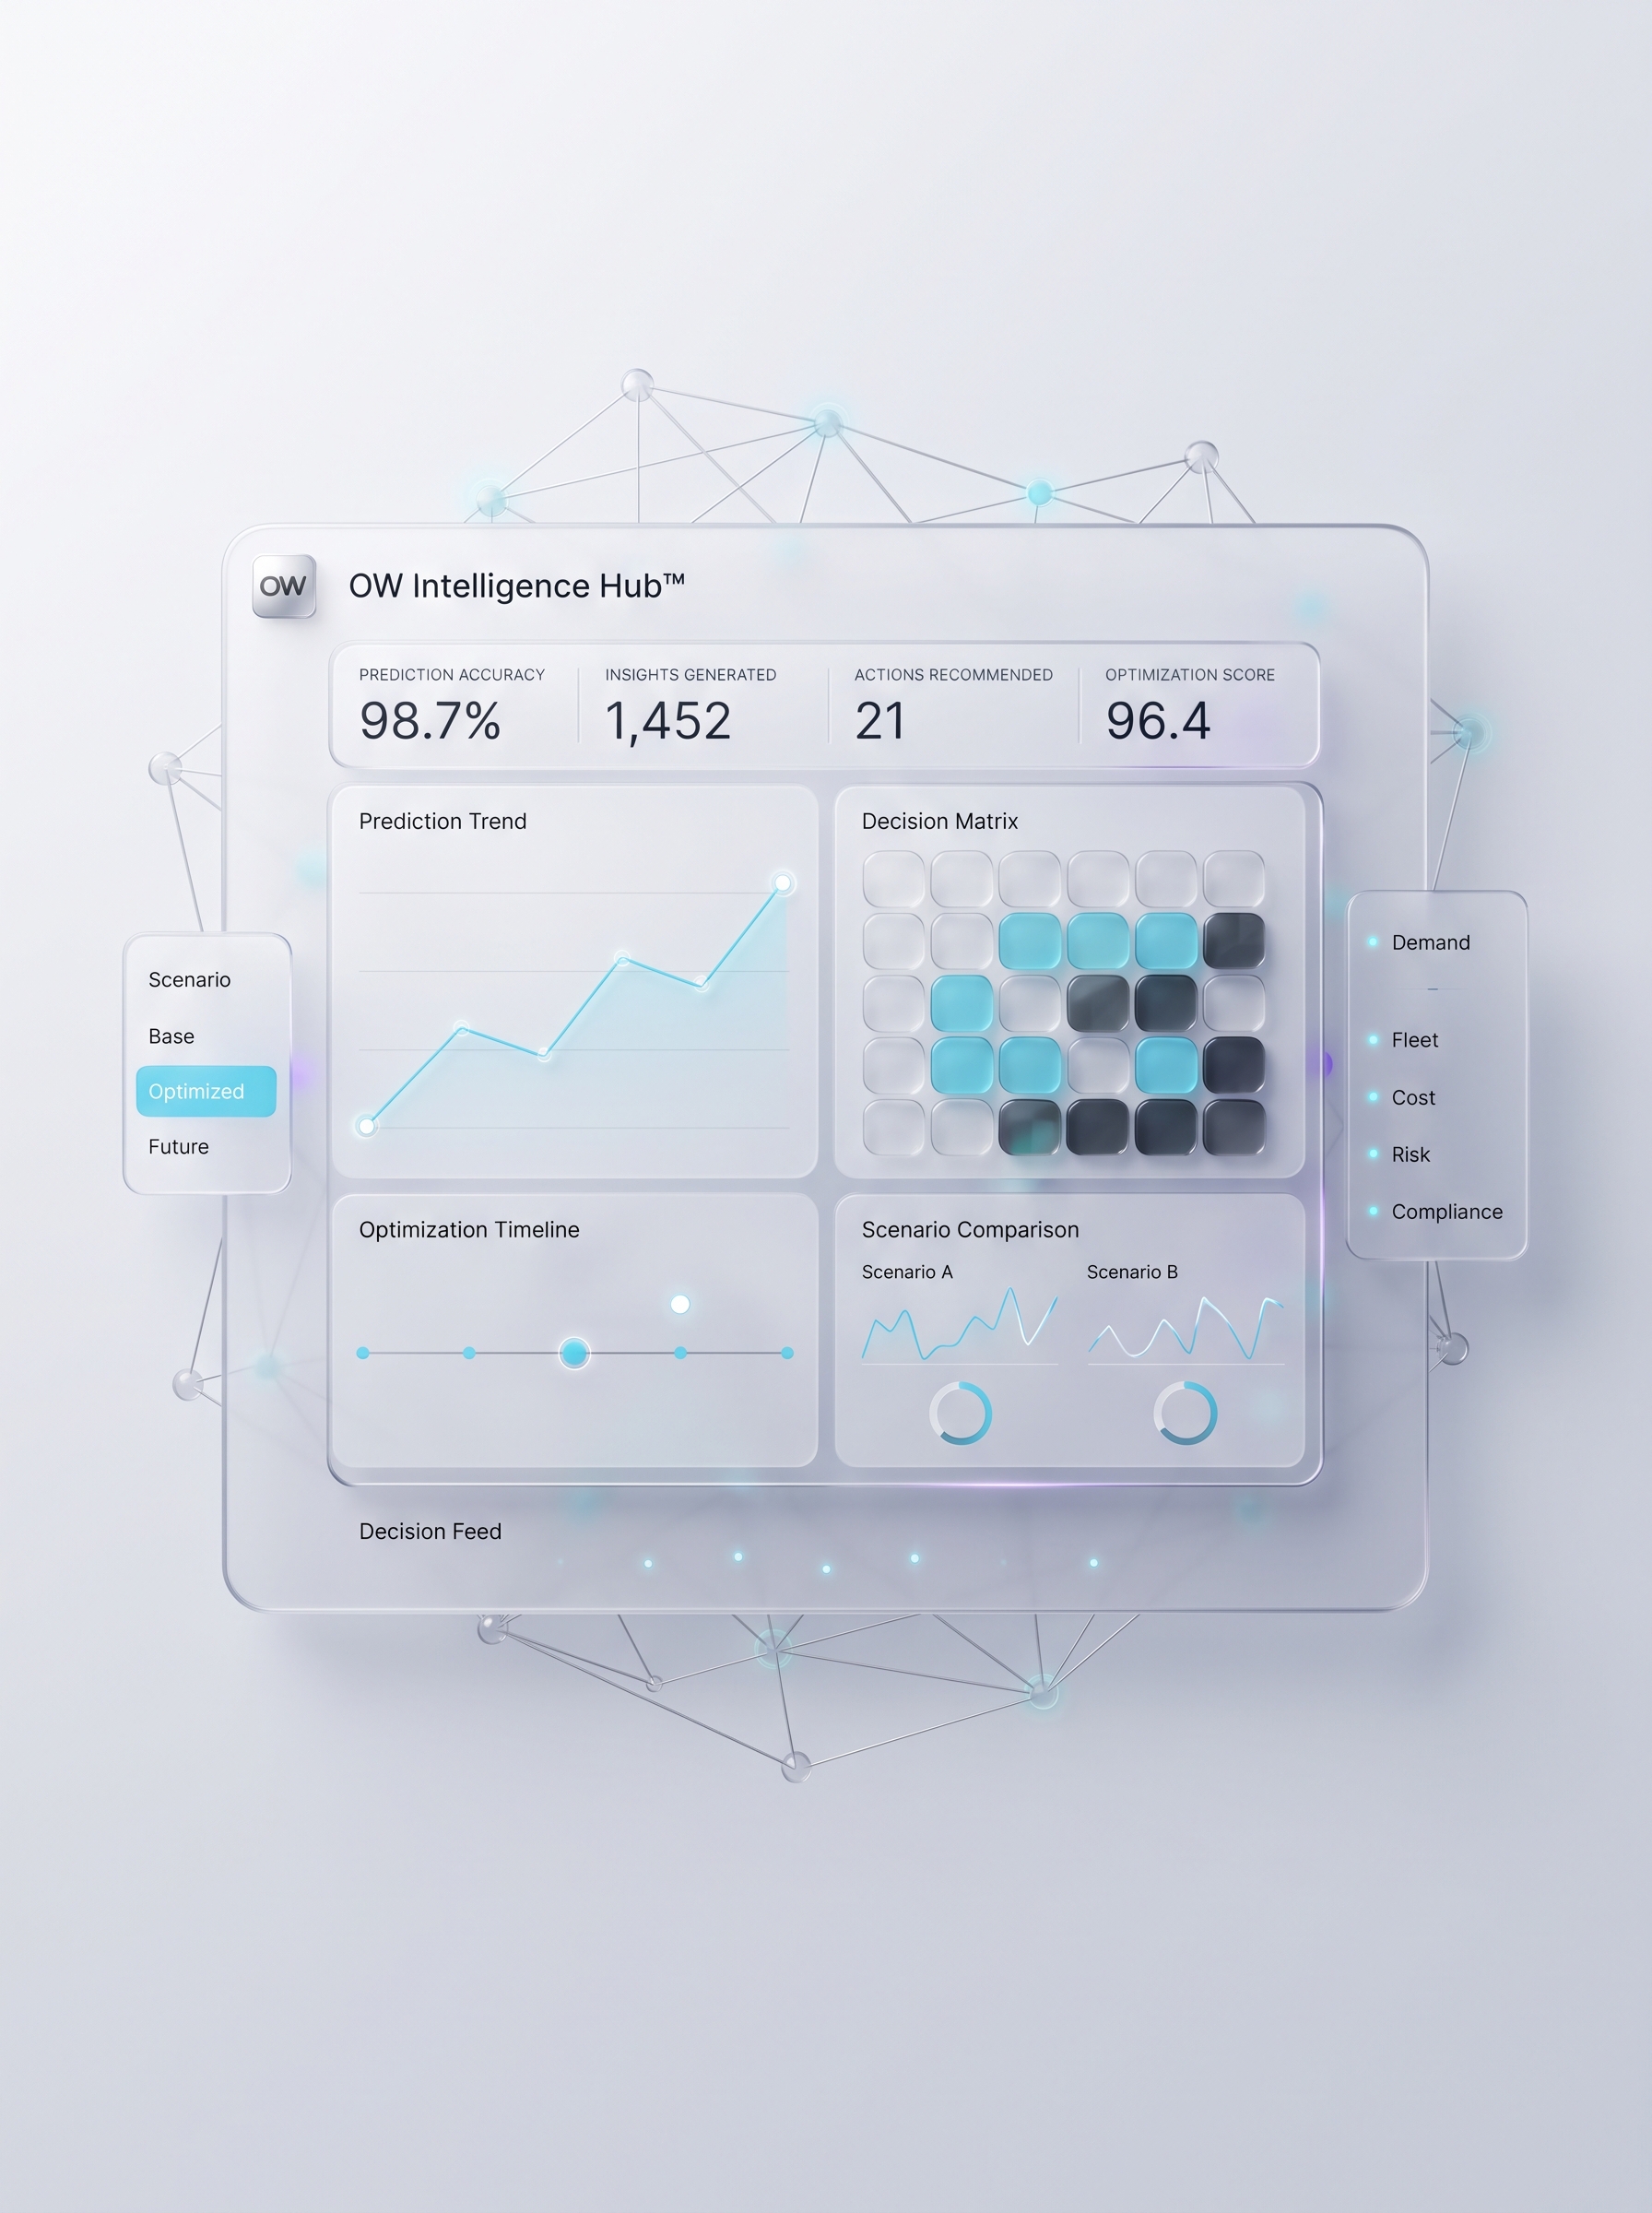
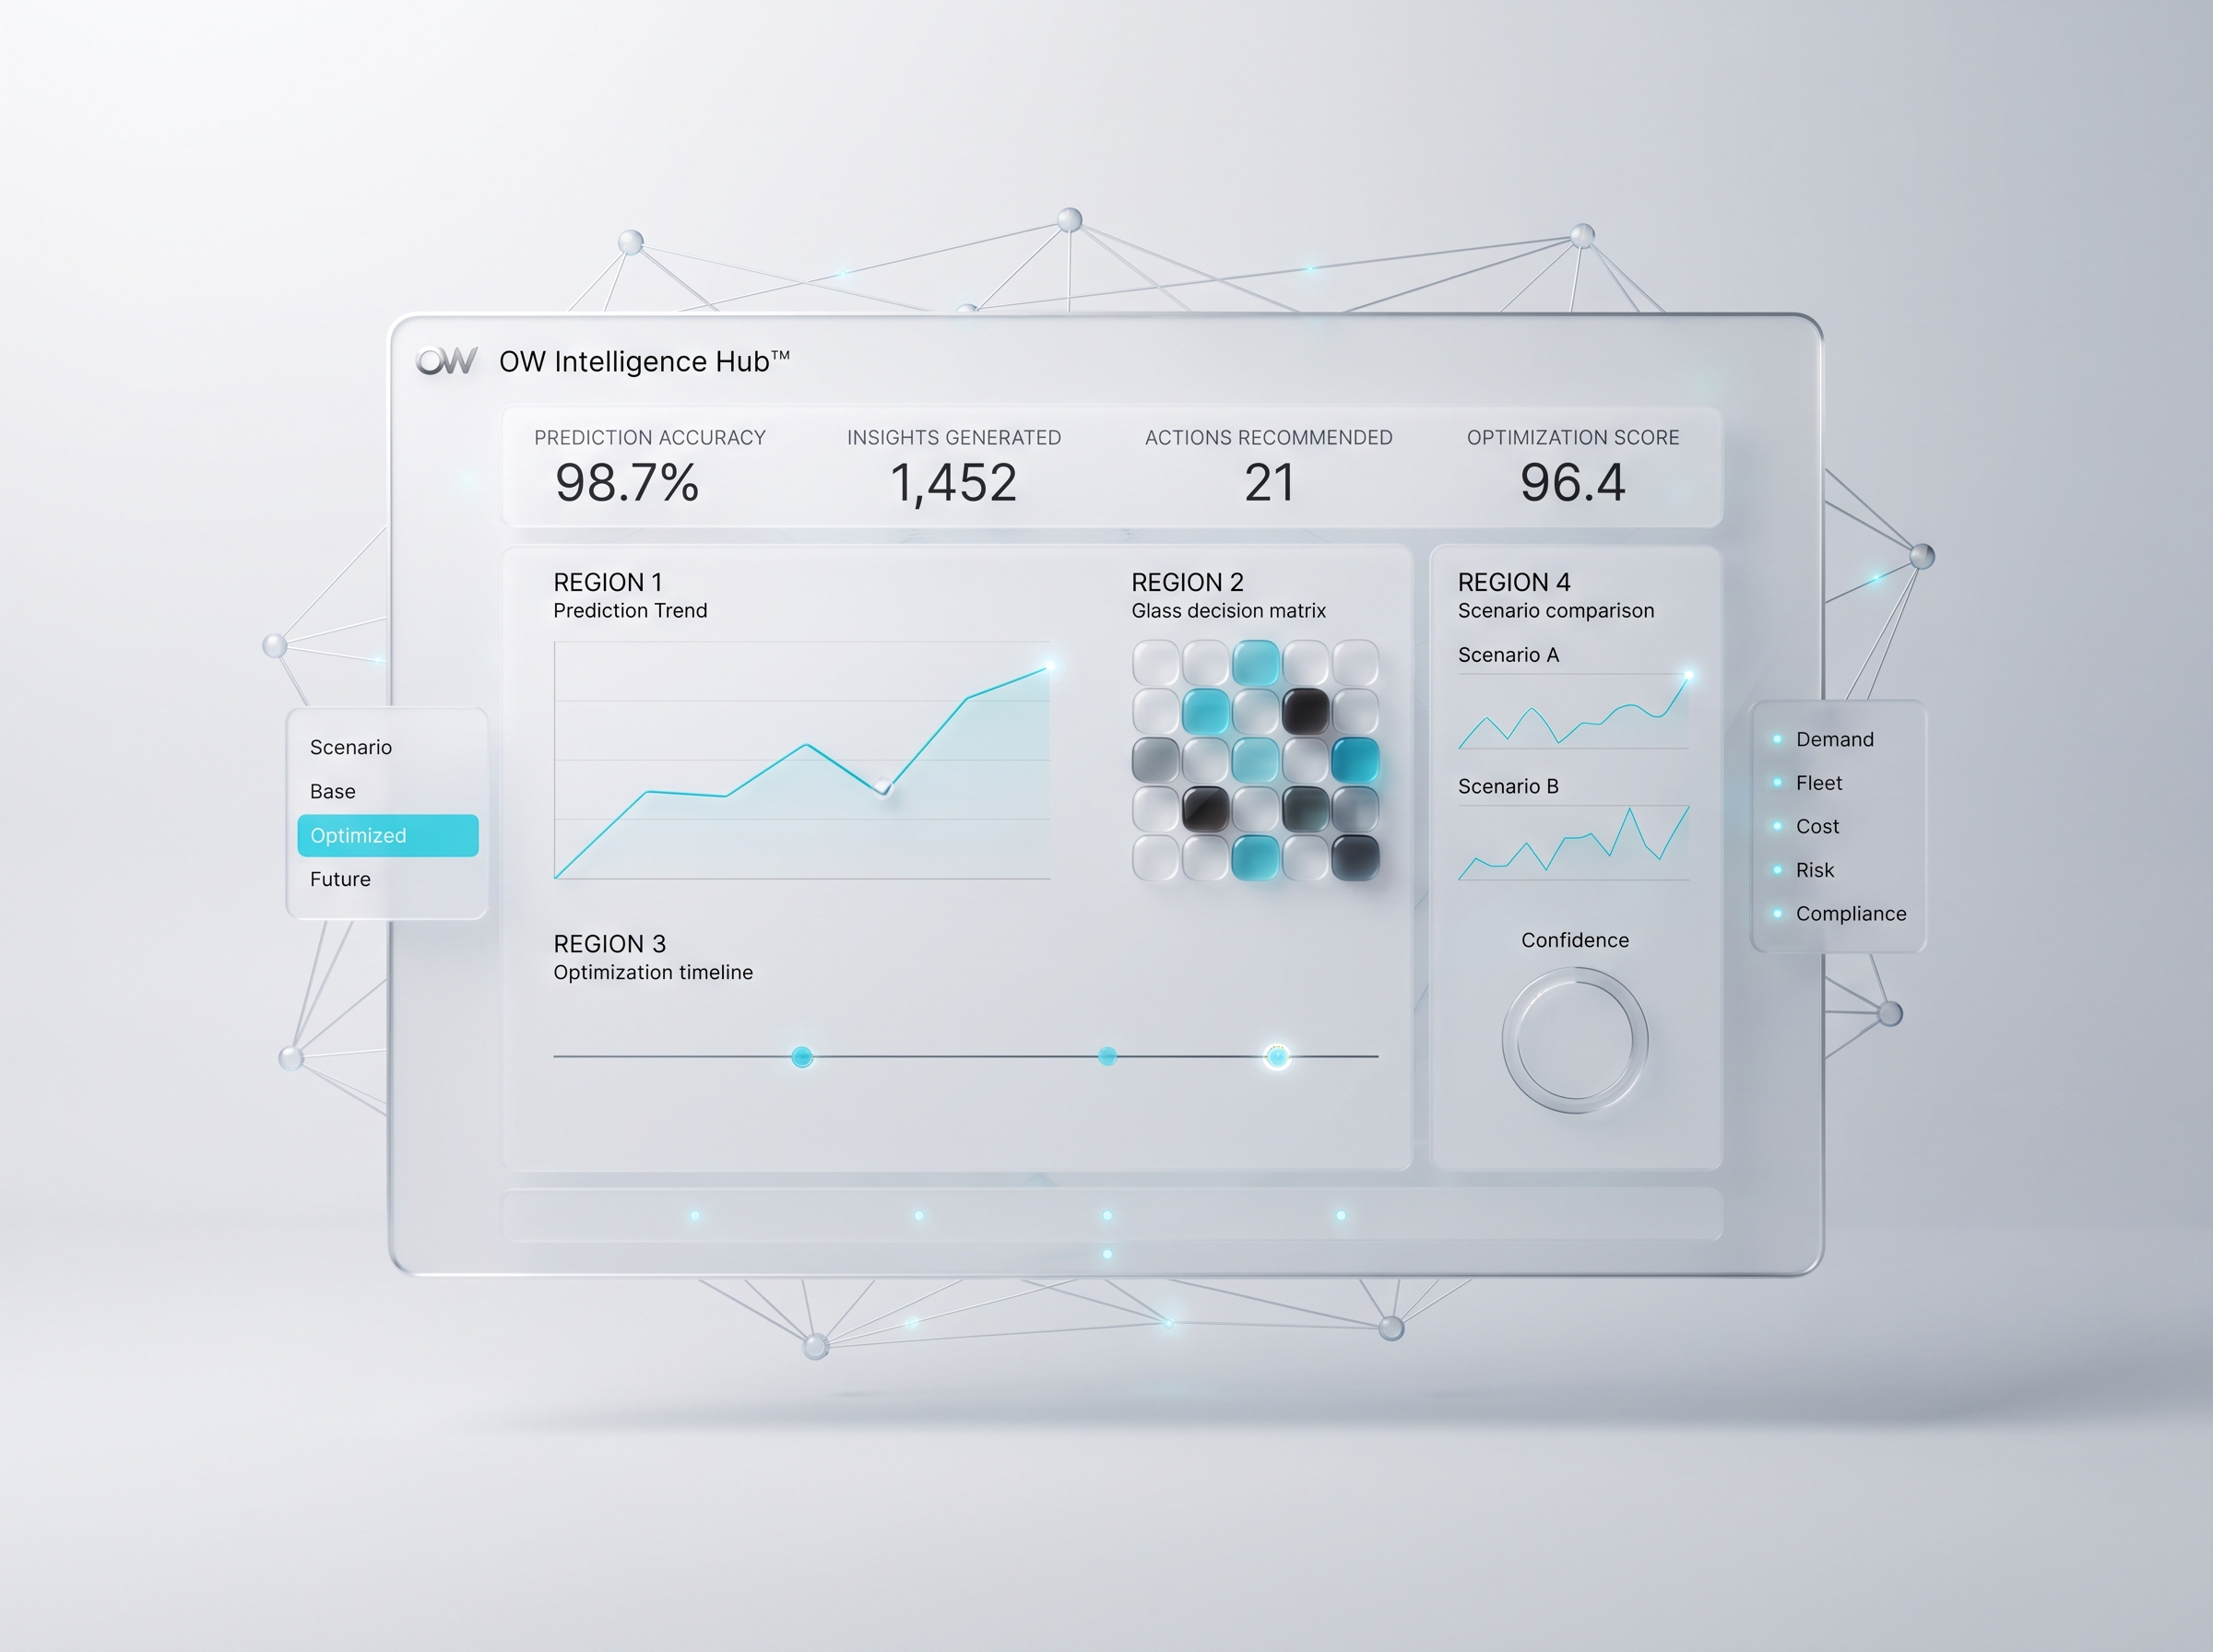
HOW WE THINK
UNDERSTAND
People and constraints before models.
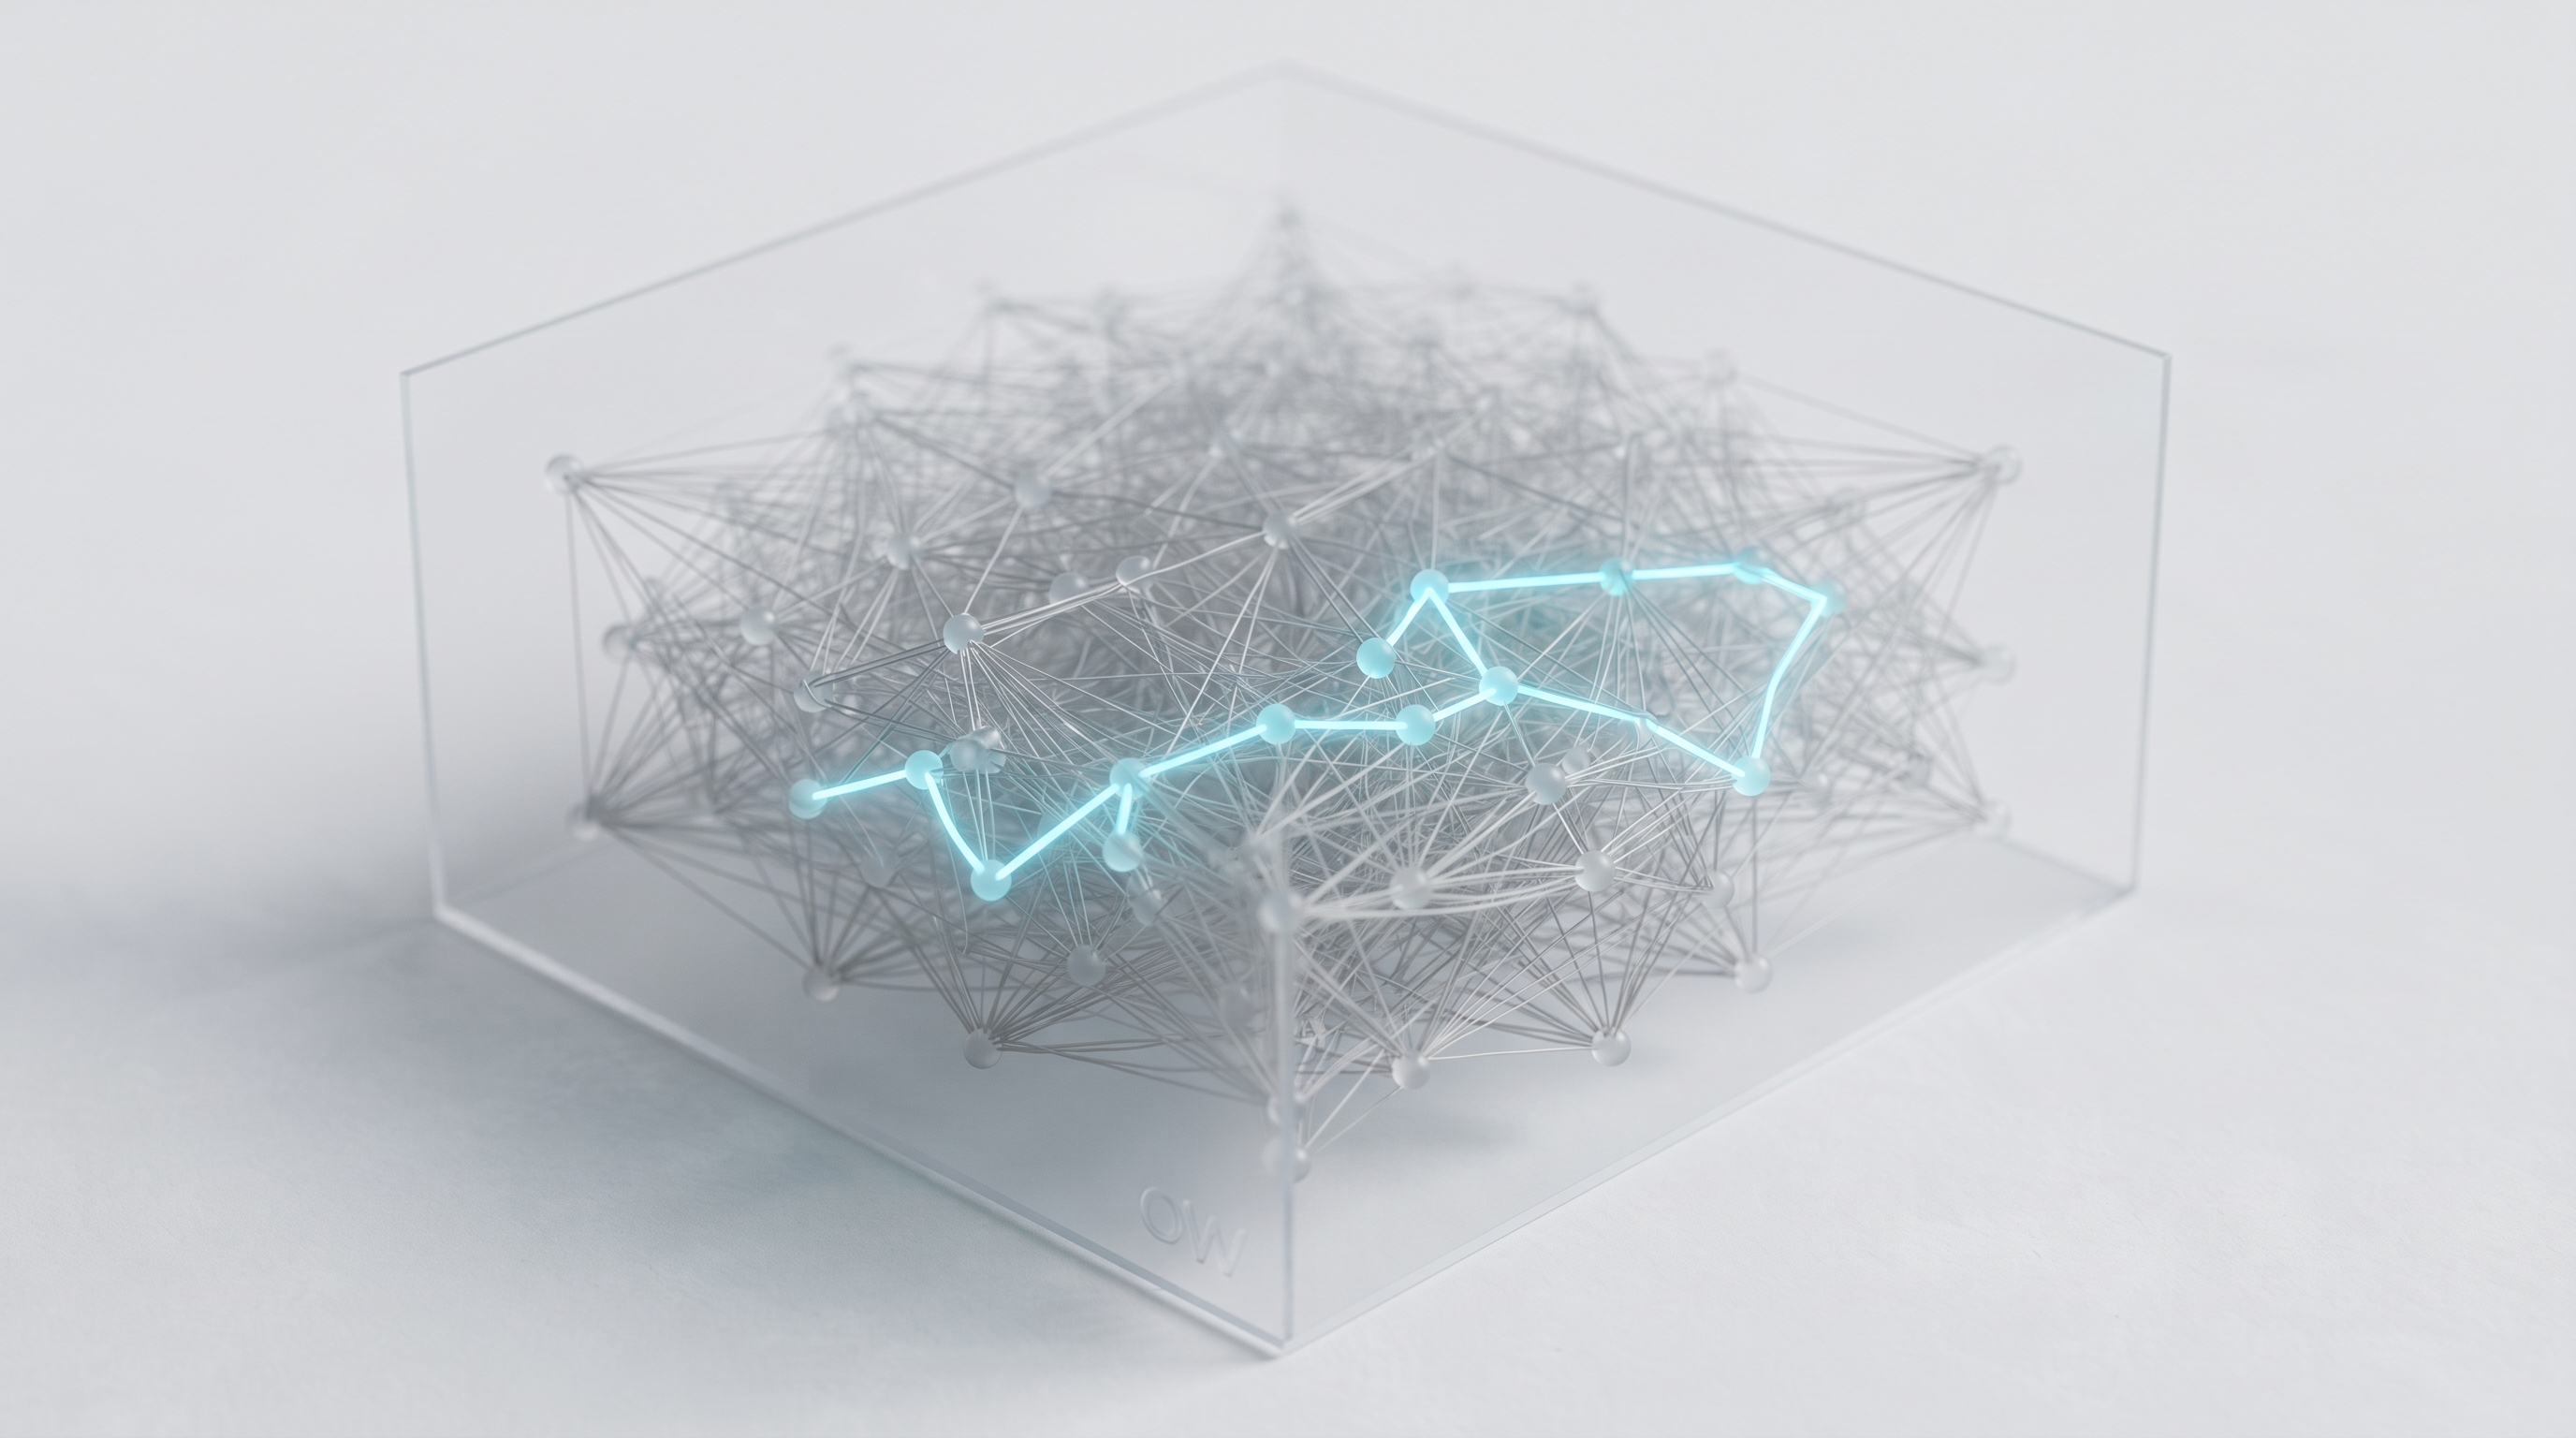
MODEL
Complexity becomes a structure you can reason about.
DECIDE
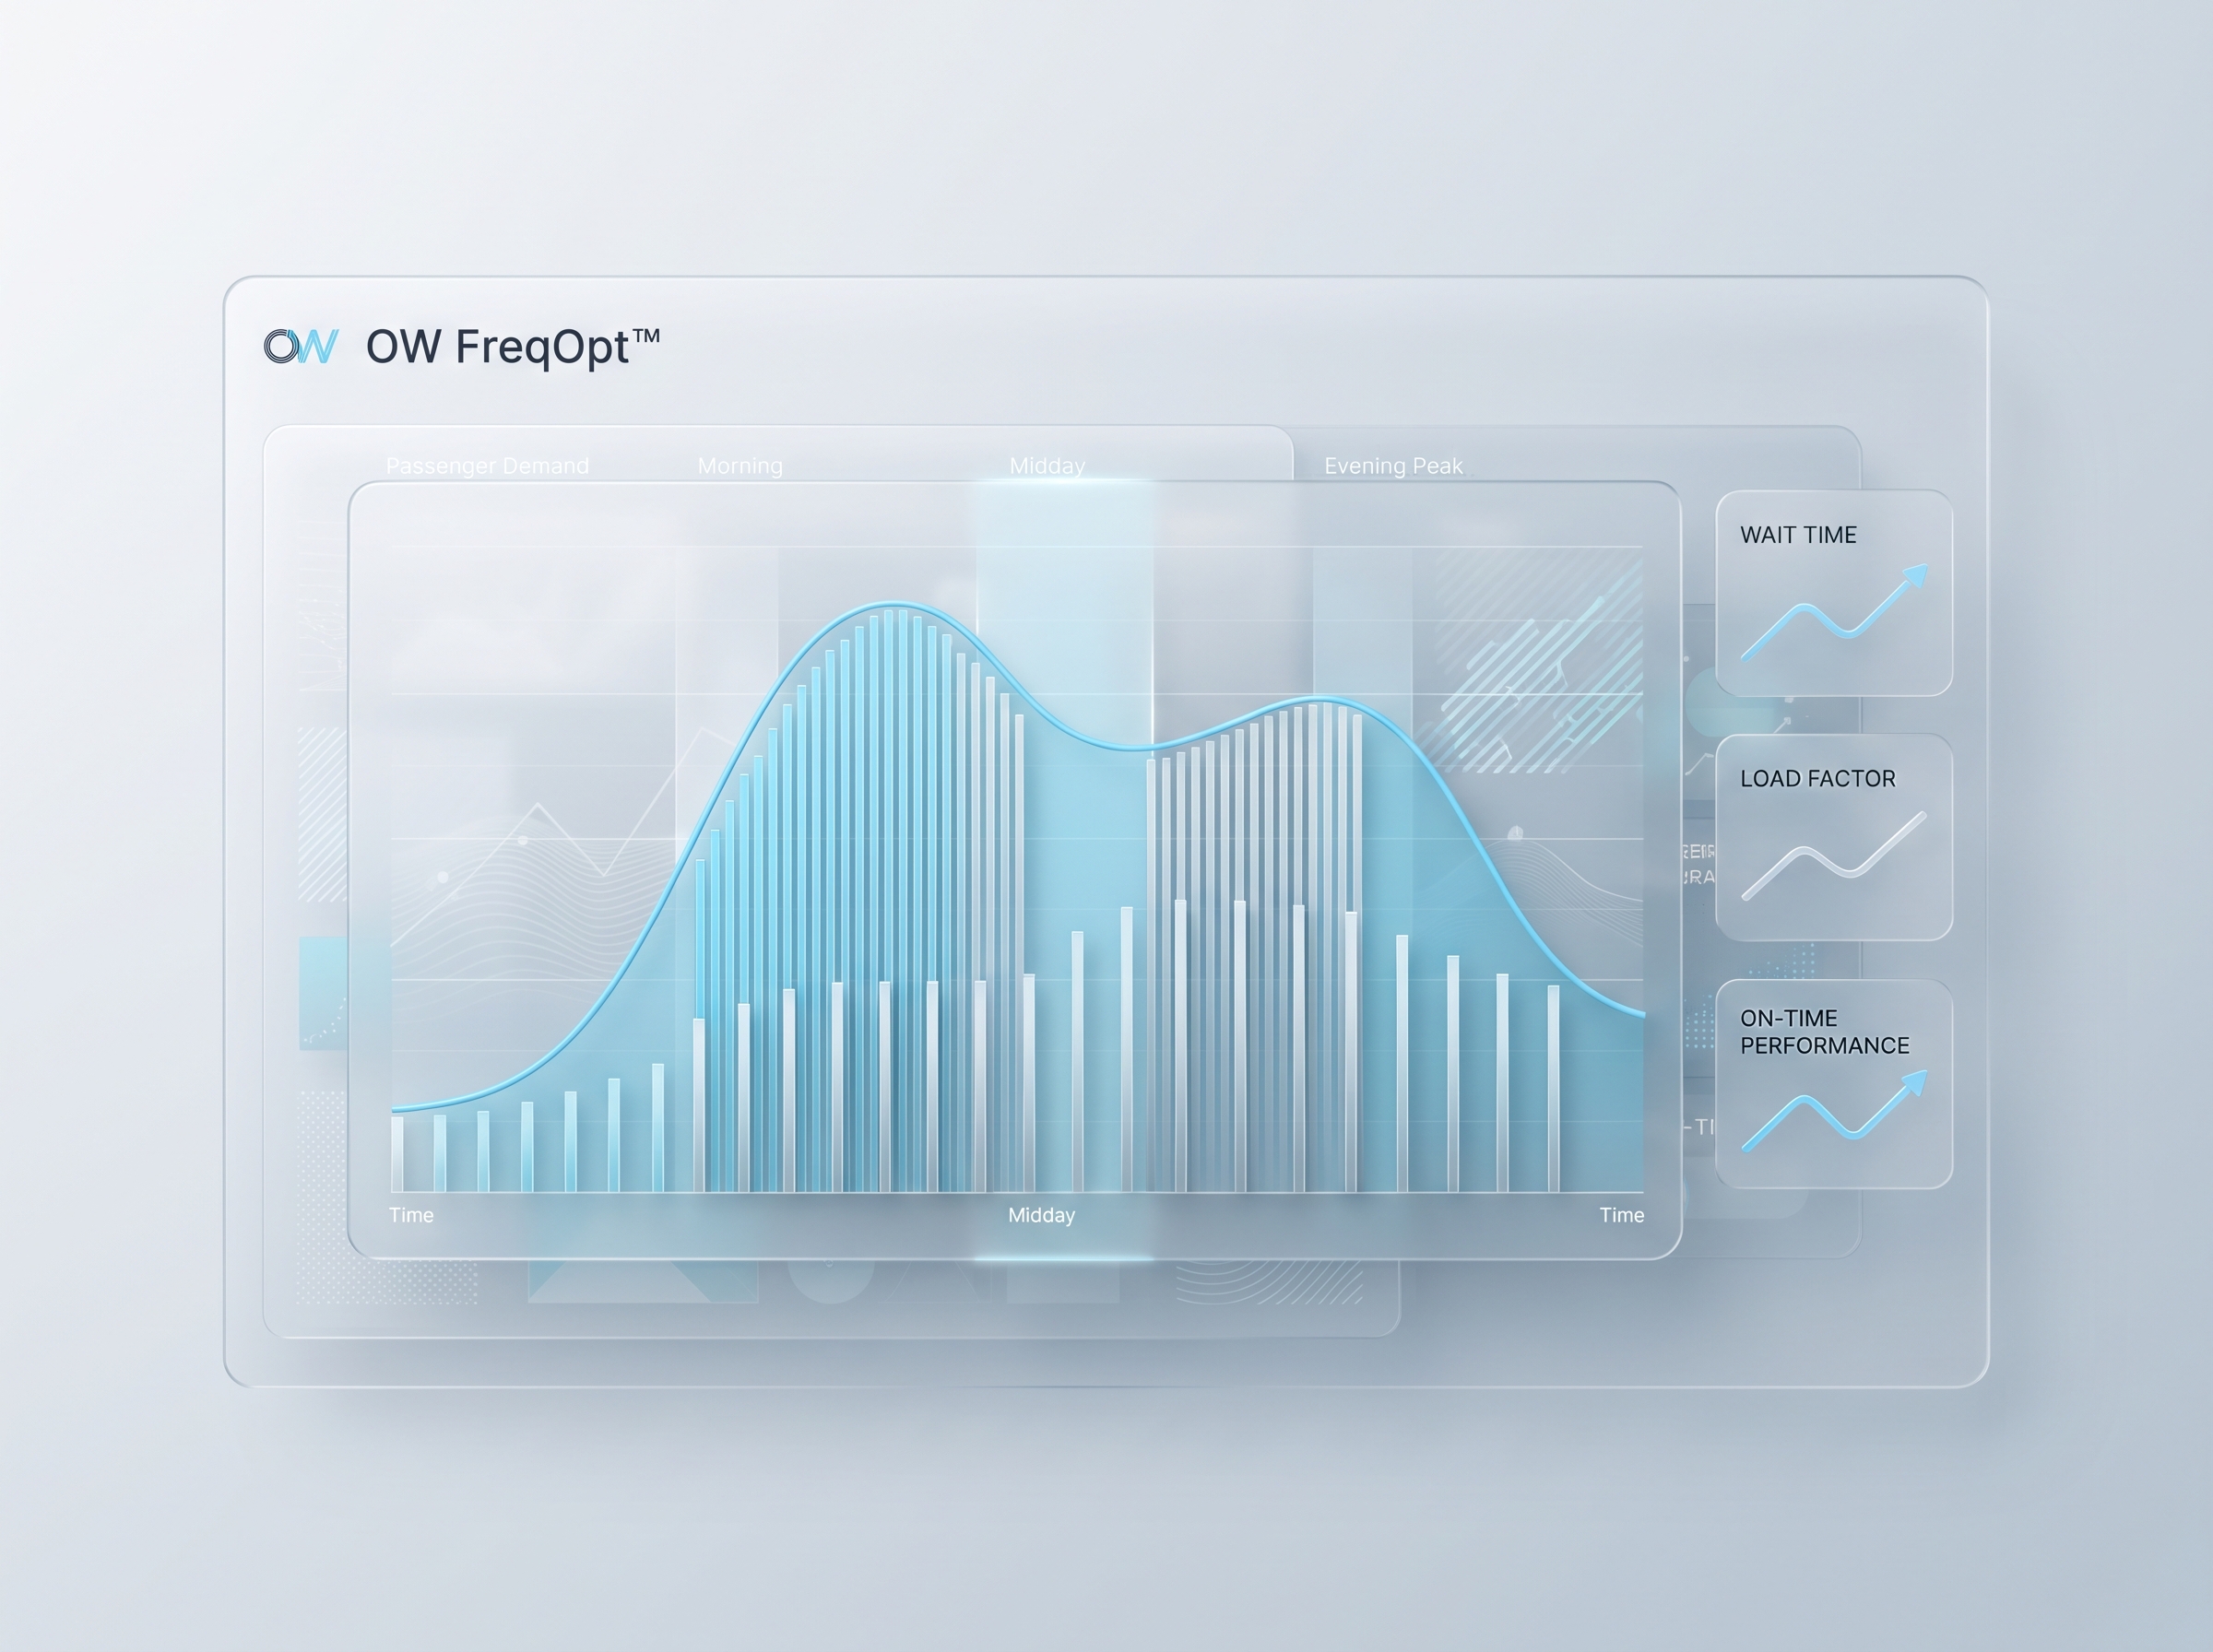
OW FreqOpt™
Decision-grade options — not another dashboard.
OPTIMIZE
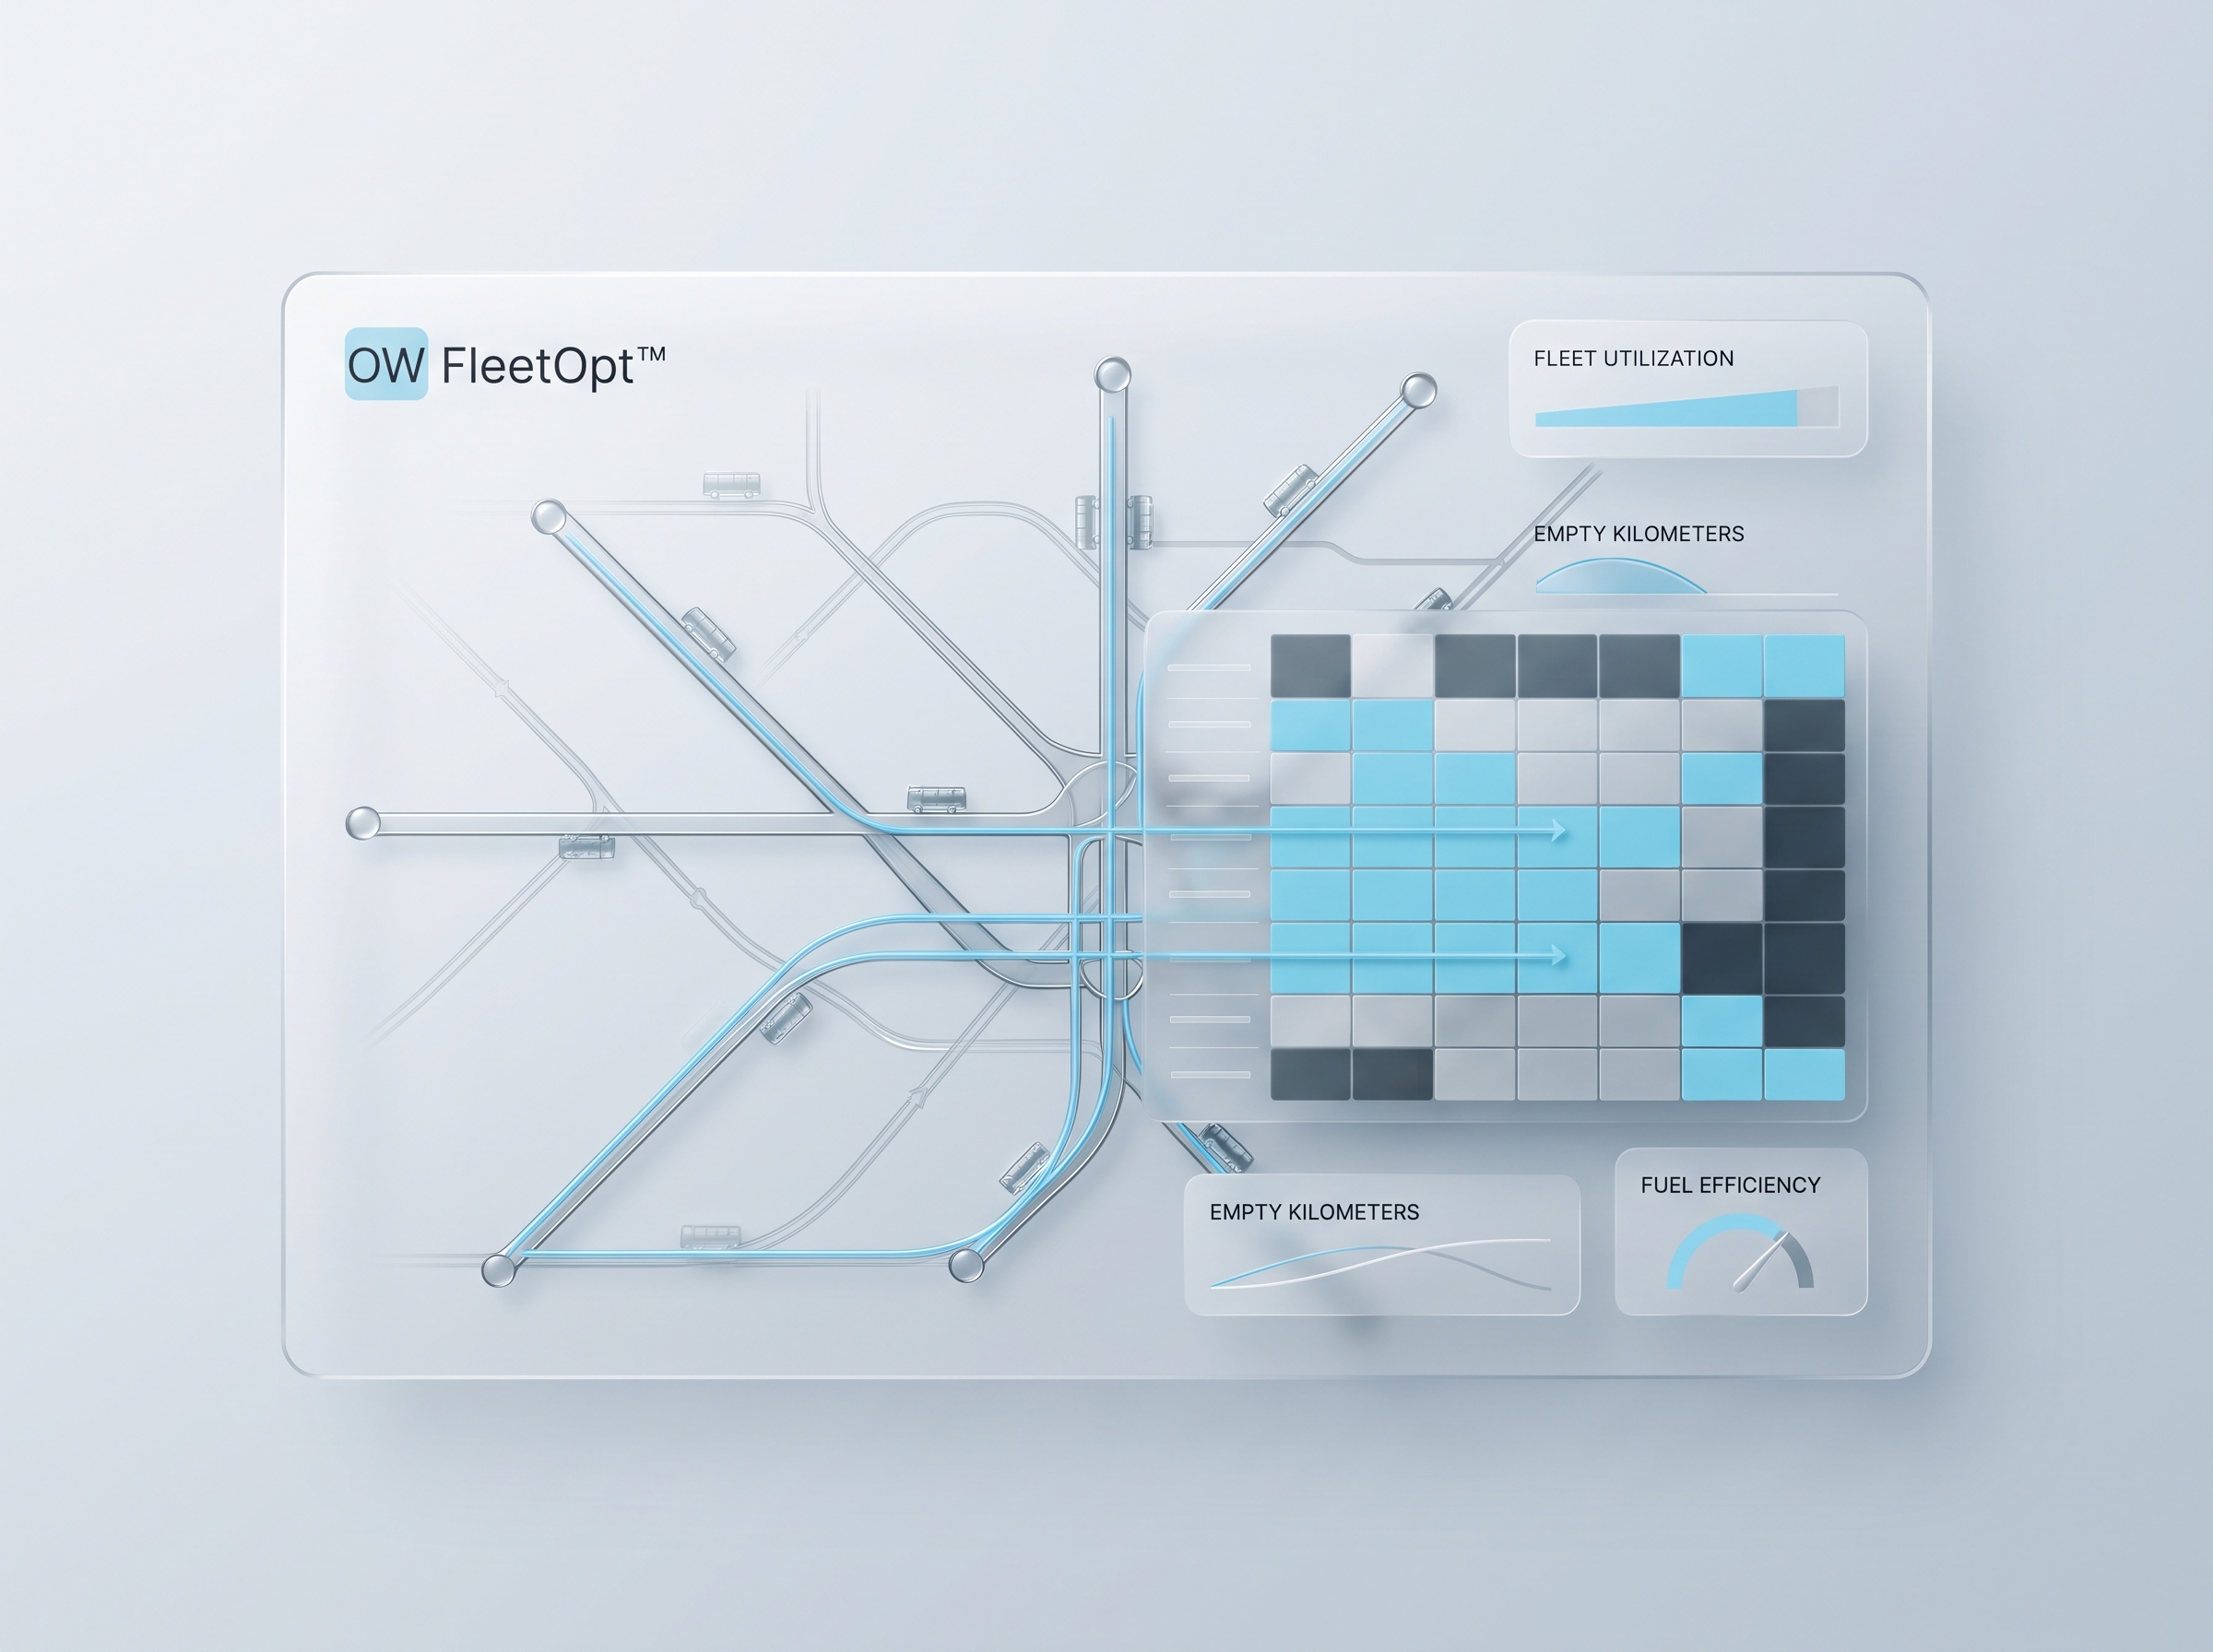
OW FleetOpt™
Better service on the street — not only on a chart.

PEOPLE

Because cities move people — and every schedule, fleet block, and frequency choice shapes daily life.
It isn't about more charts. It is about decisions that hold under budgets, labor rules, and passenger expectations.
We build the layer between raw operational data and accountable action.
Better service, lower cost, equity, and reliability rarely move in one direction. OW makes those tensions explicit.
Coverage
Cost
Reliability
Frequency
Speed
Access
Today
Learning
When trade-offs are visible, organizations can choose — and defend — what matters most.
OW is built on mixed-integer programming, constraint modeling, and operations research — so recommendations stay feasible, auditable, and repeatable.
OW
Decision Intelligence
Optimization
Simulation
Operations Research
PASSIVE ANALYTICS
Explains yesterday.
DECISION INTELLIGENCE
Decides what to do next.
We don't automate decisions. We improve them.
Each cycle turns operational reality into clearer models, sharper decisions, and stronger next steps.
Understanding compounds. So does institutional capability.
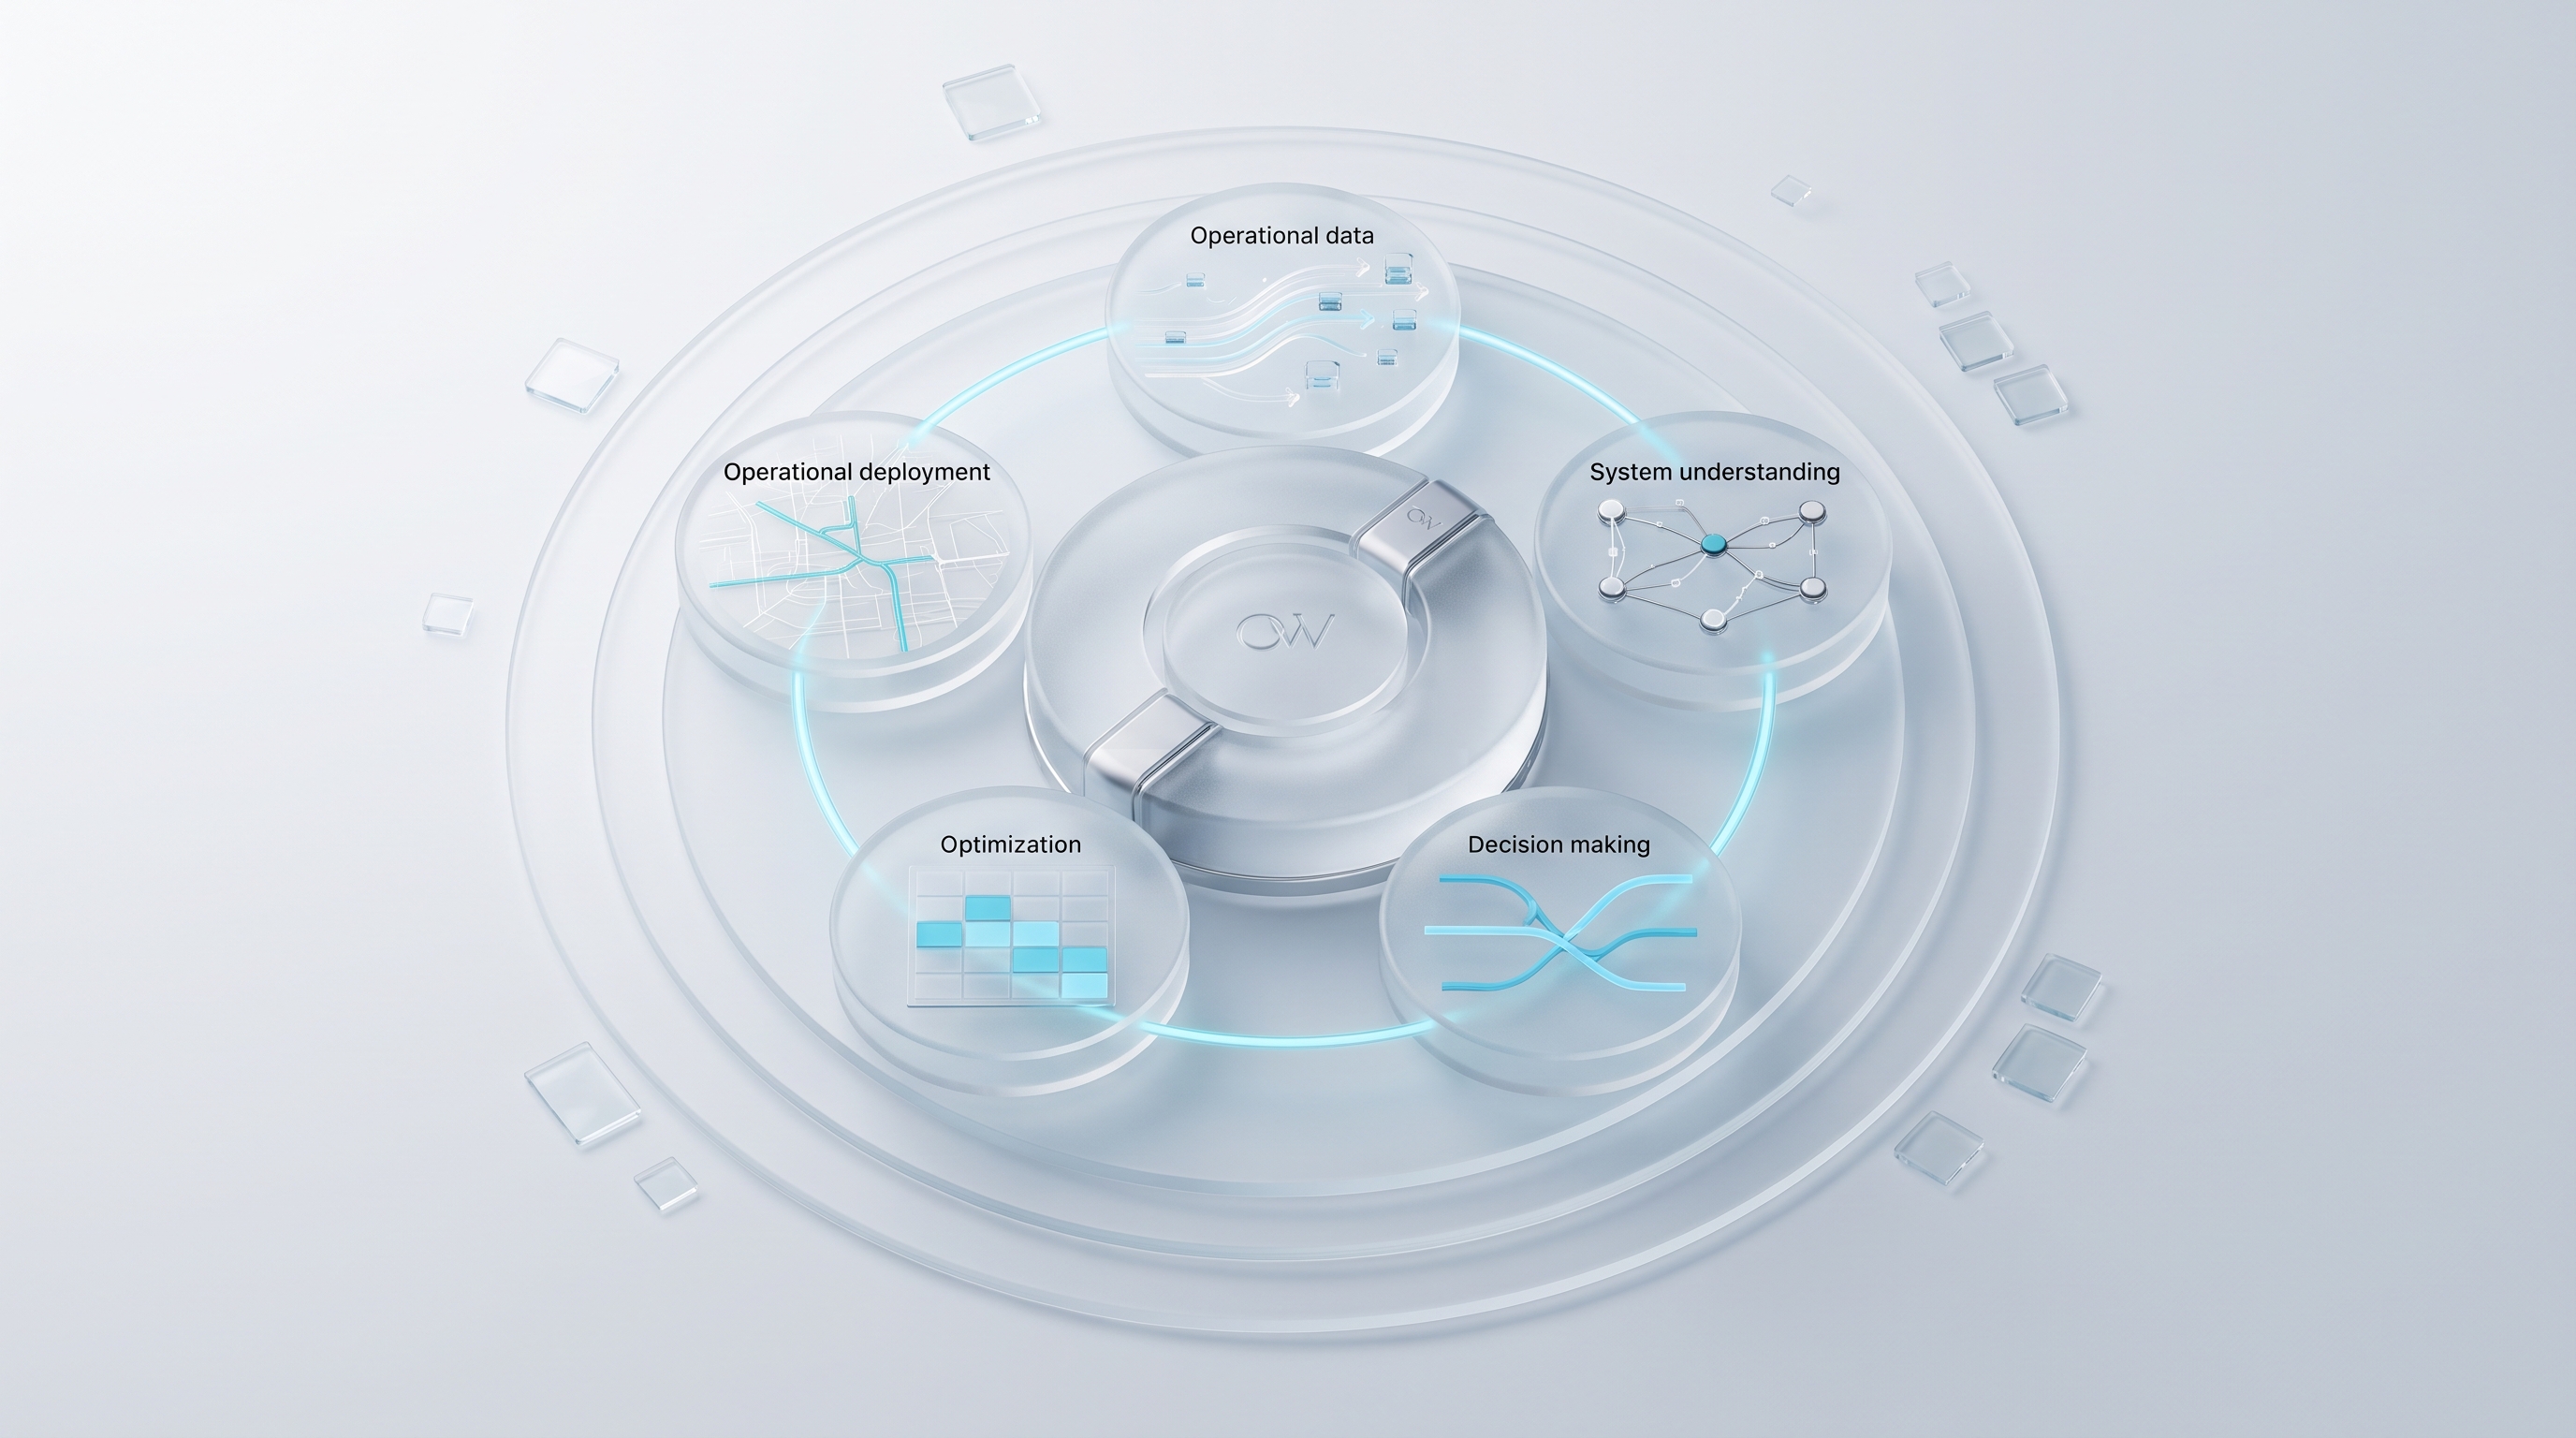
Continuous learning.
Every loop strengthens the next.
MULTIDISCIPLINARY
MEASURED IMPACT
20–40%
Dead mileage reduction potential
10–30%
Operational cost improvement range
OTP↑
Reliability gains under explicit limits
Targets are set against baselines and constraints — not anecdotes.
Formal decision science and systems modeling sit at the core.
We test future solutions — not only explain the past.
Outputs stay transparent, interpretable, and auditable.
Judgment stays central; tools strengthen it.
Only measurable improvement can be optimized.
Operations, constraints, and behavior are treated as one whole.
We envision systems that continuously learn, adapt, and improve — so organizations move beyond static plans and reactive fixes.
By 2030, we aim to support decision-grade transit optimization across 50+ cities — explainable, accountable, and grounded in measurable outcomes.

Because better cities begin with better decisions.
And better decisions begin with understanding the system.
The cities that move well are the ones that chose to understand themselves first.
We help with the understanding.
Better systems.
Better decisions.
Better cities.
Built on science.
Designed for decisions.
Continuously improving.
Founded in 2026 at TEKMER İzmir.