9 min read
What People Actually Expect from Public Transport (And Why It's Still Not Being Met)

Written by Dr. Ümit Kuvvetli
Founder & Chief Optimization Scientist
A Nurse Waiting at the Stop
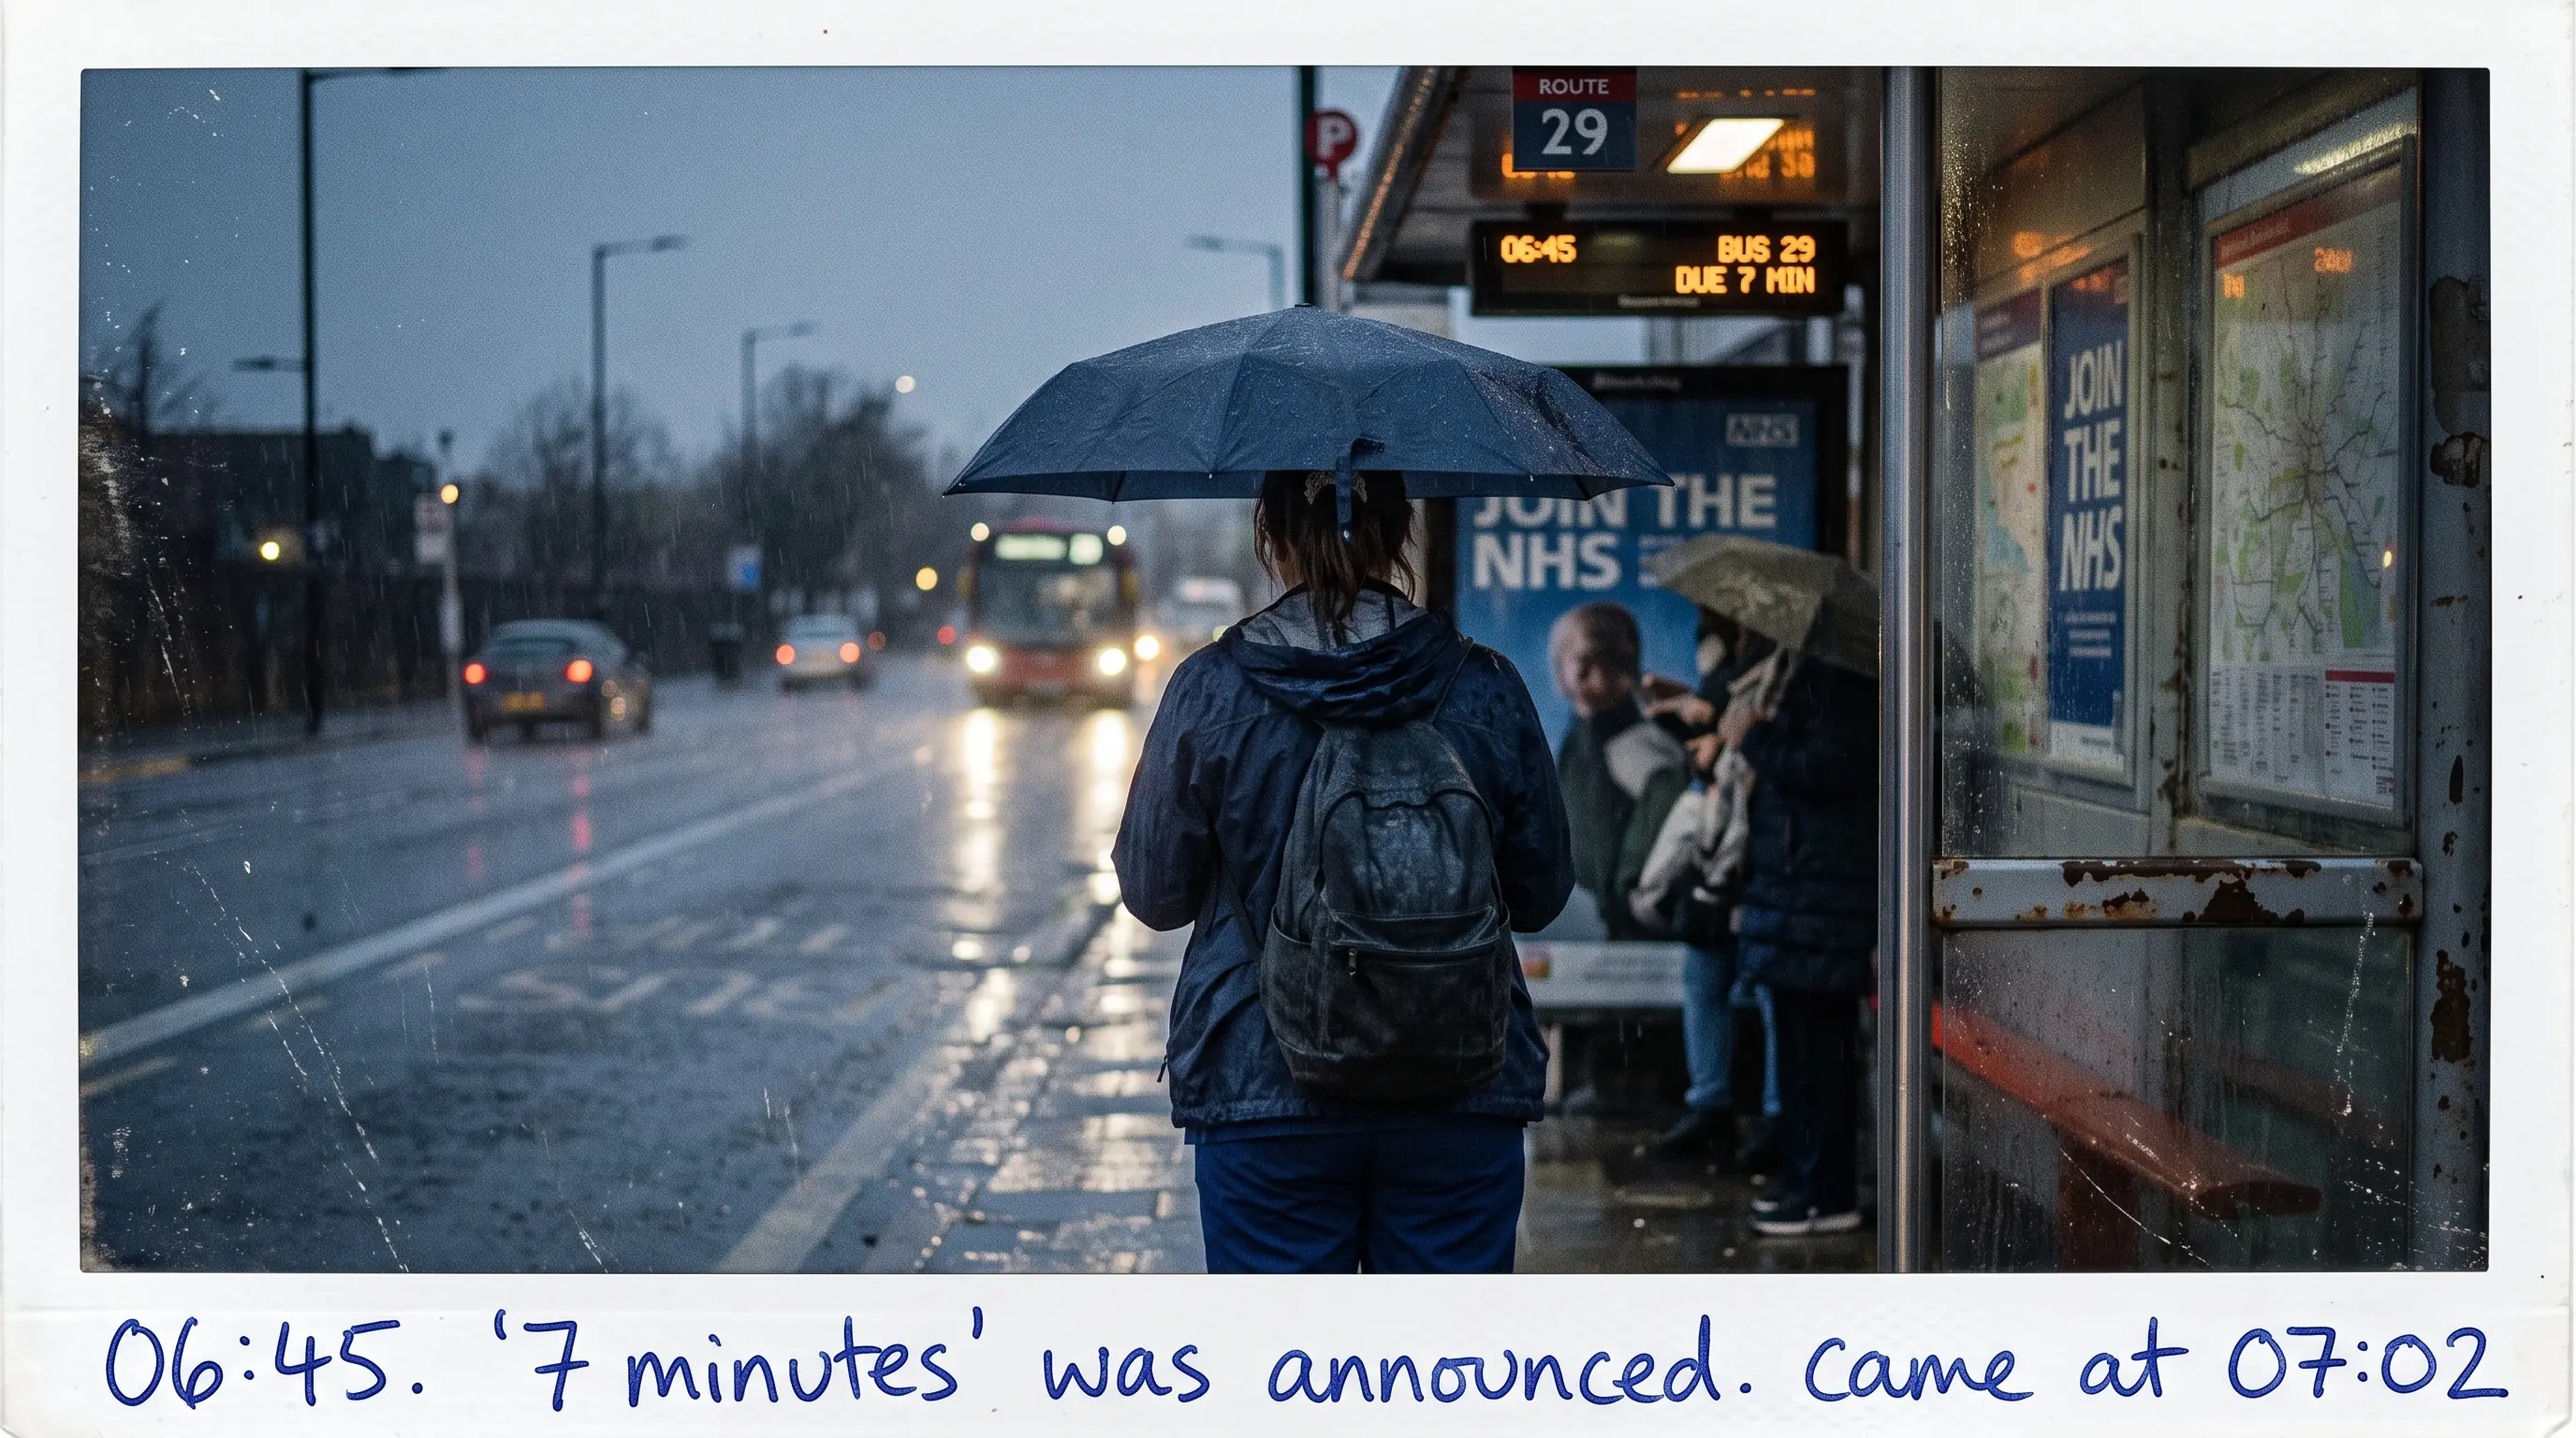
6:45 AM. A bus stop in Istanbul. Drizzle. A nurse stands, checking her phone. The app says "7 minutes." At 6:52, it still says "7 minutes." At 6:58, it changes to "2 minutes." The bus arrives at 7:02.
How many people use this stop every day? 200. 500. 1,000. Each waits an average of 15 minutes. In one year, the total waiting time at this single stop: 90,000 hours. Just this one stop. This city has 500 stops. Multiply. The number will stun you.
45 million hours. Per year. Just waiting.
Now ask yourself: If we could cut that waiting time in half, what would happen? 22.5 million hours recovered. People would arrive at work fresher, pick up their children earlier, elderly passengers would spend less time in the cold. Do we need new buses to achieve this? No. We just need to use the existing fleet more intelligently.
So why isn't it being done?
The answer is simple: The system was designed for its own continuity, not for the people. Budgets, election cycles, political pressures, staff appointments, procurement processes — all of these come before the passenger's expectations. Until someone steps up and asks, "What does the data actually say?"
We Already Know What People Want
Research by IPPR and More in Common, surveying over 5,000 people, clearly maps out what passengers expect from public transport. The study was conducted in Britain, but the findings are remarkably applicable to Turkey. Similar satisfaction surveys by İBB and EGO reveal the same issues being raised with the same frequency.
The most common complaints:
| Issue | Rate (UK) | Estimated (Turkey) |
|---|---|---|
| Delays/cancellations | Most common | Most common |
| Network gaps | 2nd most common | 2nd most common |
| Transport costs | 3rd most common | 3rd most common |
Notice: Price is what everyone talks about. But according to the research, reliability is a bigger problem. People prefer an expensive bus that actually arrives over a cheap bus that doesn't.
Expectation #1: "Let Me Know When It's Coming"
A system's most basic function is to be predictable. If passengers don't know when the bus is coming, they can't plan. If they can't plan, they don't trust the system. If they don't trust it, they look for alternatives. If they can't find alternatives, they get frustrated.
This cycle repeats millions of times every day.
Why Isn't It Solved?
Data flows are disconnected. GTFS-RT (real-time data) in most cities is either incomplete, unreliable, or non-existent. The operations center and the passenger information system aren't even using the same data. One knows the truth, the other displays fiction.
How OW Addresses This
OW GTFSHub™ validates incoming data. Any false position, incorrect arrival time, or data contradicting operational reality is filtered out before reaching the passenger.
OW Intelligence Hub™ consolidates all data sources into a single reliable source of truth. Whatever the operator sees, the passenger sees.
The result: The passenger checks their phone. The app says "3 minutes." The bus arrives in 3 minutes. This is the rebuilding of trust in a city.
Expectation #2: "Don't Break My Budget"
The research shows that transport costs compete with other essential needs. In the UK, 63% of people say vehicle expenses make it difficult to afford other necessities.
In Turkey, this figure is even higher. Inflation, fuel prices, rising VAT — public transport fares have become one of the most sensitive items in household budgets.
A revealing finding: All income groups prioritize making public transport more affordable and accessible. New road construction, however, is only supported by higher-income groups. This carries a political message: public transport investment is more inclusive than road investment.
Why Isn't It Solved?
Municipalities say "we have no budget." But more often than not, it's not a budget problem — it's an efficiency problem. The existing fleet, existing fuel, existing staff — no one is looking at how they're being used. Empty mileage isn't measured. The alignment between demand and supply isn't analyzed.
How OW Addresses This
OW CostLogic™ analyzes operational costs and identifies where savings can be made. Reducing empty kilometers, optimizing fleet allocation, adjusting service frequency to match demand — these three changes alone can deliver 15–25% more service with the same budget.
The result: Lower unit costs → either fares go down, or service quality goes up at the same price. The municipal budget doesn't increase, but service quality does.
Expectation #3: "Let Me Travel Without Fear"
The research's most striking finding: Safety concerns are significantly above average among women, young people, people with disabilities, and minority communities.
| Group | Safety Concern Level |
|---|---|
| Women | High |
| Young people | High |
| People with disabilities | High |
Turkey shows a similar pattern. At metro stations, bus stops, night services — the perception of safety directly affects public transport usage.
Why Isn't It Solved?
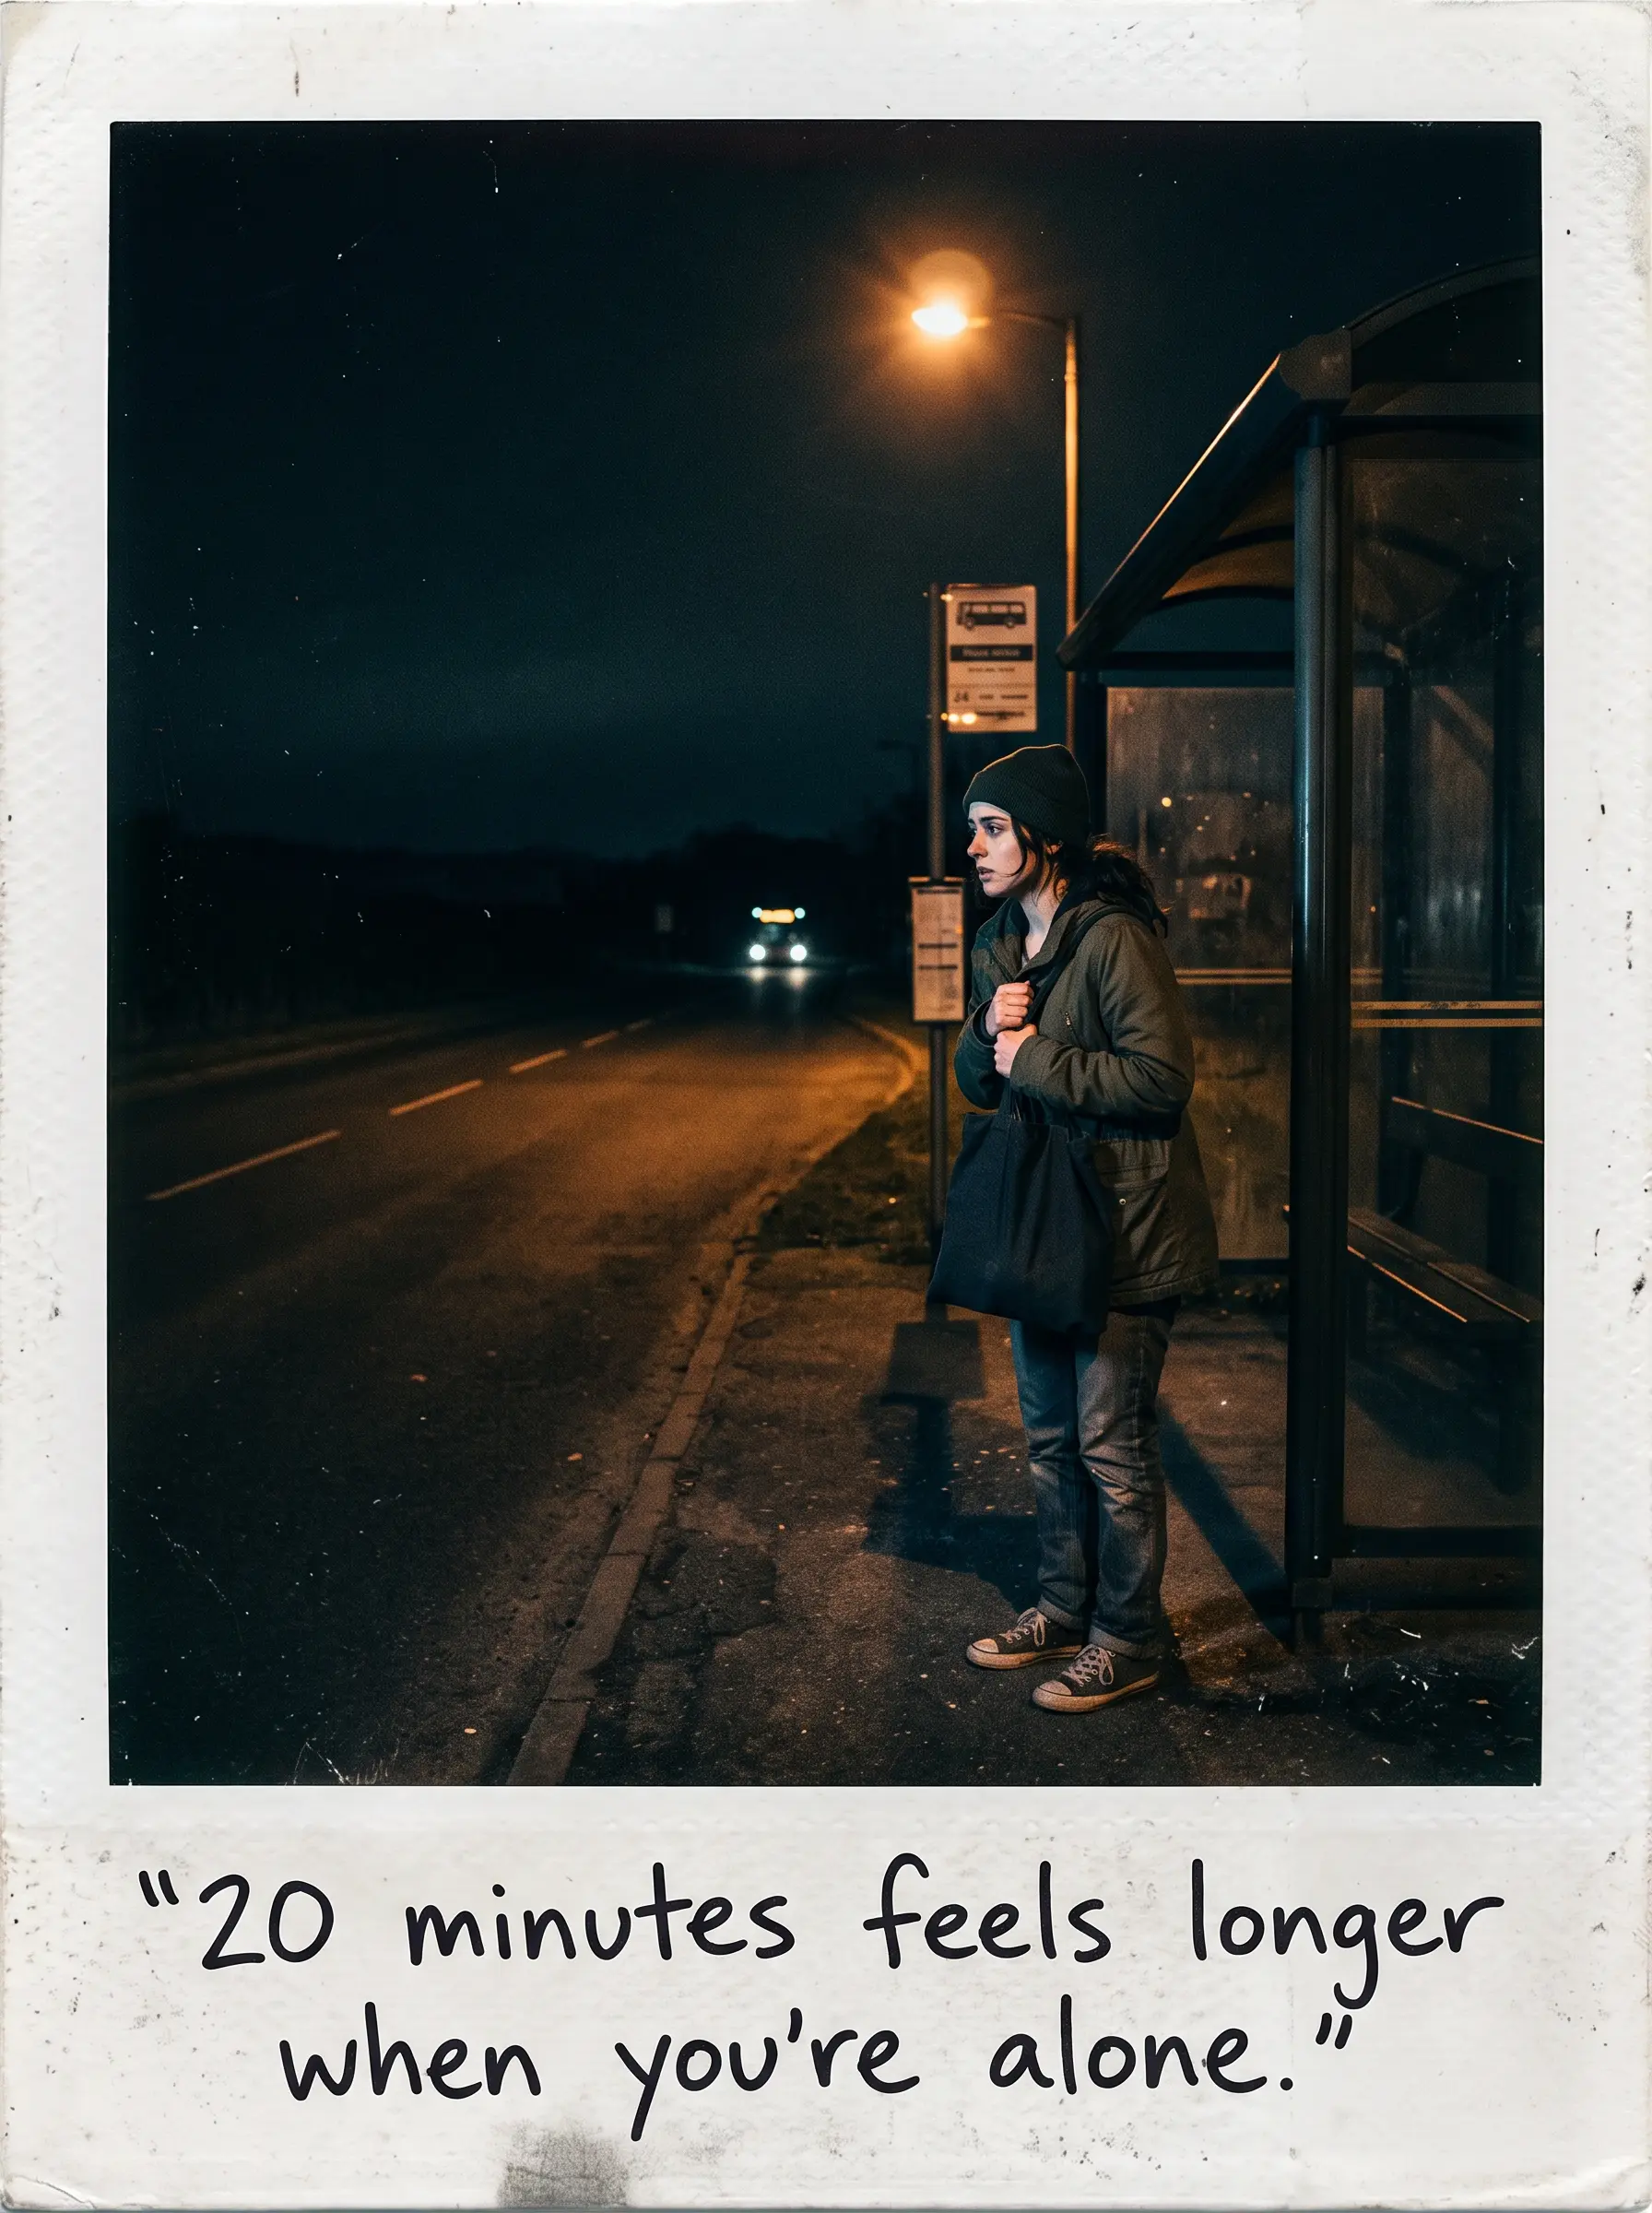
Safety is usually addressed with physical measures (cameras, lighting, security personnel). But safety also has a perceptual dimension. The longer the wait at a stop, the higher the perceived safety risk. Even with security personnel present, a woman waiting 20 minutes is more anxious than one waiting 5 minutes.
How OW Addresses This
OW FreqOpt™ optimizes service frequency to reduce waiting times. Especially during evening hours and in areas where safety risk is perceived as higher, increasing frequency achieves the same effect as physical measures — perceived safety improves.
OW RiderSense™ analyzes passenger satisfaction and safety perception data. Which stops, at which times, on which lines is safety concern highest? This data enables more effective resource allocation.
The result: The passenger waits 5 minutes at the stop. The bus arrives. They board. They alight. They walk. They never think "what if." Safety is successful when it becomes silent.
So Why Is It Still Not Being Met?
Three expectations. Each one clear. Each one with a known solution. So why have the same complaints been repeated for decades?
Because the system's operation is shaped more by its institutional continuity than by passenger needs. Budgets, election cycles, political pressures, staff appointments, procurement processes — all of these come before the passenger's expectations.
The IPPR research's most important finding is this: The fear of political backlash is larger than the backlash itself.
London's ULEZ (Ultra Low Emission Zone) didn't lose elections. Stockholm's congestion charging didn't lose public support. In fact, Barcelona's "superblocks" even gained votes for the incumbent party.
Politicians either don't know or don't want to hear that public transport improvements are popular.
Where Does OW Fit Into This Picture?
OW is more than a software company. It is an advocate for data-driven, people-centered planning.
- GTFSHub™ for reliability.
- CostLogic™ for costs.
- FreqOpt™ for safety.
All of these answer the same question: Is the system working for people, or are people working for the system?
And the answer is clear: When the system works for people, everyone wins. Passengers are happier. Municipalities are more efficient. Cities are more liveable.
📊 Is Your Municipality Meeting These Expectations?
The question to ask at the next budget meeting is this: "Are we using our data correctly to meet our citizens' expectations?"
OW provides the tools municipalities need to answer "yes" to that question.
Start in two steps:
👉 1. Free Operational Efficiency Pre-Assessment — Let's analyze your current system's data quality, empty mileage rate, and demand-frequency alignment.
👉 2. 15-Minute Consultation Appointment — Let's discuss your municipality's specific needs and determine which OW solution is right for you.
Resources
- İBB — Public Transport Satisfaction Survey (2025)
- EGO General Directorate — Passenger Satisfaction Report (2025)
- Transport for London — Public Attitudes Towards Transport (2025)
OW Suite solutions:
- OW GTFSHub™ — Data Integrity & Validation
- OW CostLogic™ — Operational Cost Structure & Scenario Comparison
- OW FreqOpt™ — Frequency & Headway Optimization
Frequently Asked Questions (FAQ)
Is reliability more important than fare price for passengers?
Research consistently shows reliability ranks ahead of price. Delays and cancellations quickly erase the advantage of a cheap ticket. Passengers prefer a bus that arrives over one that doesn't — regardless of fare.
Can service quality improve without increasing the municipal budget?
Yes — more often the problem is inefficiency, not budget. Empty mileage reduction, demand-aligned frequency, and fleet allocation optimization can deliver 15–25% more service capacity with the same budget.
How does GTFS-RT data quality affect passenger trust?
When the operations center and passenger apps show different data, trust collapses. Validation layers like GTFSHub™ ensure every arrival prediction reaching the passenger aligns with operational reality.
Related Posts
Continue with adjacent topics—from mixed-integer programming (MIP) and combinatorial optimization to multi-objective scenario modeling in public transit.
How to Build a Public Transport Network in Strategy Games? Real-World Optimization
Stop traffic meltdown in Cities: Skylines–style games: headways, hub-and-spoke, dead mileage, and GTFS-grade thinking—bridging games and real transit optimization.
Beyond Routing: Why Static Scheduling is Killing Your Fleet Efficiency
Every morning, public transport planners look at maps that seem perfectly organized. But there is a silent observer that static plans fail to account for: the inherent volatility of urban life.