10 min read
The Human Factor in Public Transport Optimization: Decision Science and Artificial Intelligence Approaches

Written by Dr. Ümit Kuvvetli
Founder & Chief Optimization Scientist
The efficiency problem in public transport is rarely about the number of vehicles—it's about human behavior.
Imagine stepping onto a bus one morning. The air is cold, the windows are fogged. You settle into a seat and glance at your phone, but your eyes inevitably wander: Is the vehicle clean? Is the lighting adequate? Do the plants or natural textures inside make you feel at ease?
You think you're just going to work. But in reality, your mind is constantly calculating a "utility balance." For transportation planners, the greatest challenge lies here: How do we translate your moment-to-moment feelings into complex mathematical algorithms?
For a long time, static and deterministic models dominated the field. But modern Decision Science reveals that passengers are not merely "points" to be moved—they are multi-dimensional decision-making mechanisms. A passenger's choice to use a system depends on the balance between what operators supply and how the passenger subjectively perceives that supply. You cannot optimize what you cannot measure.
👁️ 1. Perceptual Comfort: Your Eyes Speak, the System Listens

The passenger's in-vehicle experience isn't just about "comfort"—it's a variable that directly impacts overall system cost. Recent studies have moved beyond traditional surveys to employ eye-tracking technology. Research in transportation psychology and human-computer interaction shows that such biometric data serves as a reliable proxy for measuring passenger experience. The findings are striking:
Biophilic (nature-integrated) designs: When vehicles incorporate plants, natural light, or wood textures, passengers' eye movements are less "stressed." They adapt to the environment more quickly, and travel time feels subjectively shorter.
Neglected, cluttered environments: Eye movements become random, and gaze patterns appear "scattered." This visual noise creates unconscious feelings of distrust and mental fatigue.
Operational Implication: If you're optimizing a system, it's not just about "how many minutes until arrival." The visual comfort inside the vehicle must also be a parameter in the model. A Perceived Comfort Index (PCI) can calculate the weighted average of onboard occupancy, cleanliness, and biophilic elements. This index reduces the passenger's "perceived wait time," increasing satisfaction without adding system capacity.
🧠 2. Dynamic Demand Management: Reward, Not Punishment
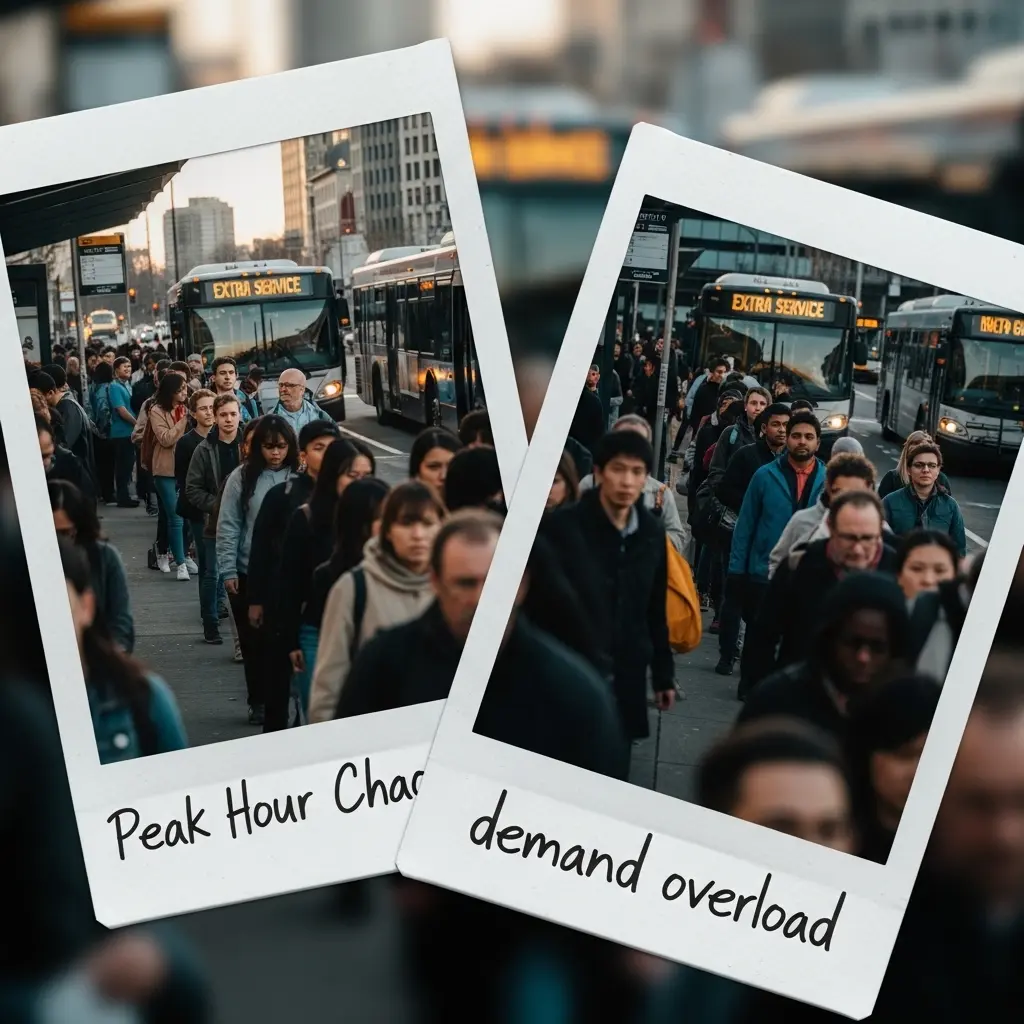
Peak-hour congestion can no longer be solved solely by adding more trips (supply-side). The DIS-HARM Model treats passenger demand as a Multi-Agent Demand Response problem. The system operates within a Reinforcement Learning (RL) loop:
The system reads the current time period, line occupancy rates, and weather as the "state."
It offers carbon credits or digital incentives (points, discounts, etc.) to travelers who shift to off-peak hours as potential "actions."
The goal is to balance network load distribution and minimize operational costs—the "reward."
This model treats passenger demand not as a passive variable, but as a steerable system input. The system continuously improves by learning, over time, how different passenger segments respond to incentives. Simulation-based studies show that this RL-driven dynamic incentive strategy can achieve meaningful peak-hour load balancing compared to static approaches (reaching the 60–70% range in controlled scenarios). This approach delays the need for new vehicle investments, reducing capital expenditure (CAPEX) and enabling more efficient use of the existing fleet. In other words, capacity management becomes possible by gently guiding passenger behavior rather than simply buying more buses.
🏔️ 3. Topographic Realism: Accounting for the Slope
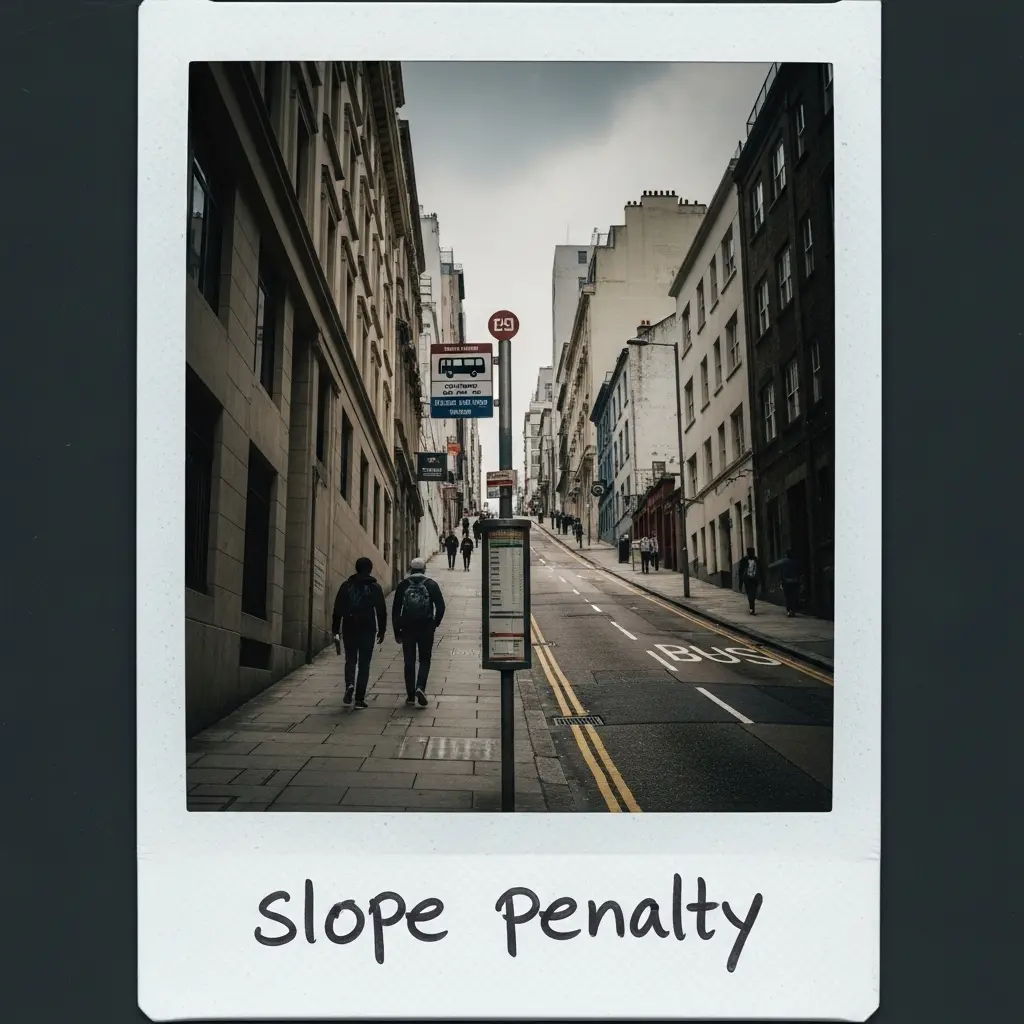
One of the most common mistakes in urban planning is calculating walking distances "as the crow flies" or on a flat plane. Research conducted in valley cities like Lanzhou has demonstrated that passengers are influenced by Terrain Spatial Perception (TSP).
Walking uphill is not the same as walking on flat ground. If an optimization algorithm only calculates the "shortest straight-line distance," it will lose thousands of passengers unwilling to climb that hill.
Operational Implication: In OW optimization models, slope is incorporated as a "Walking Impedance" coefficient. An "effective distance" is calculated based on the road's gradient. This approach is critical for repositioning stops and redesigning feeder lines. Routes planned without this correction may appear efficient on paper but result in low passenger demand in reality.
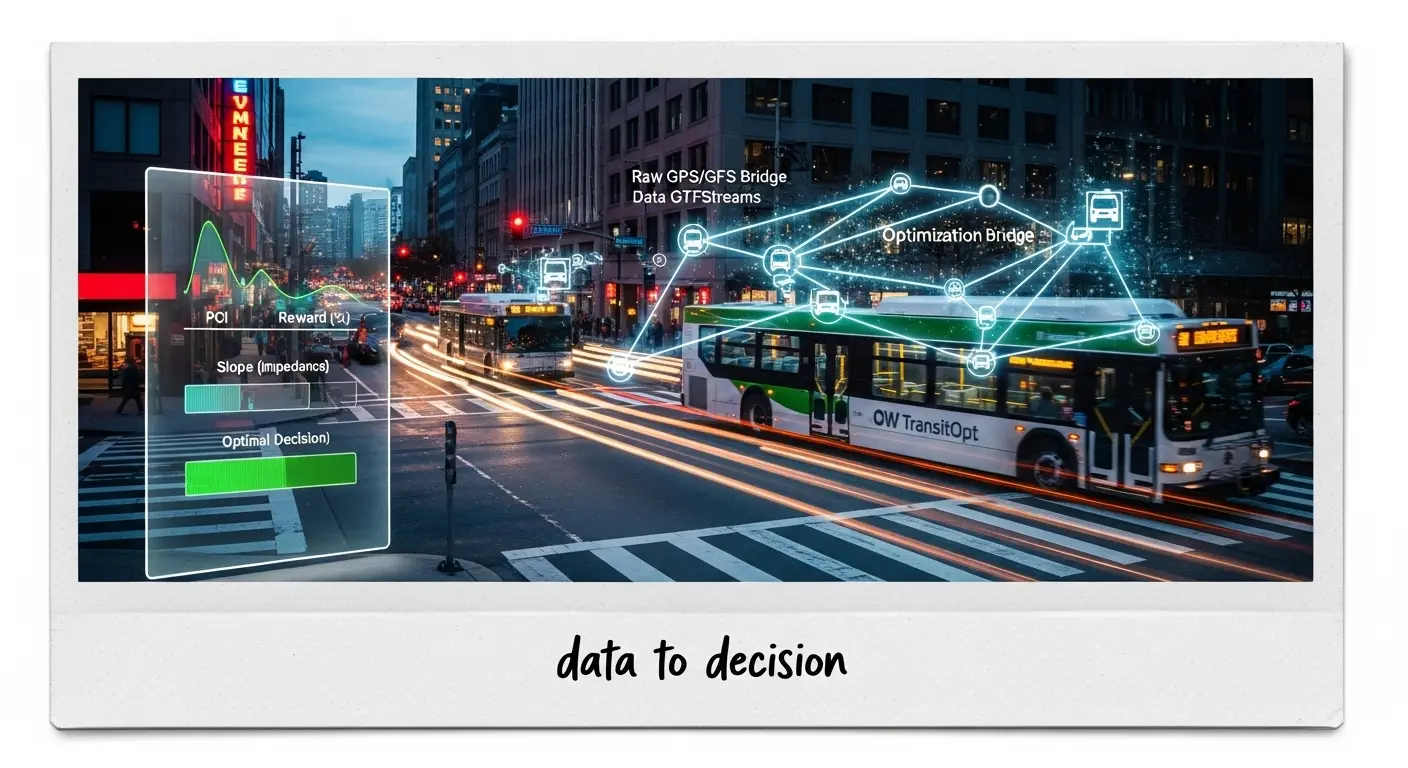
🔄 4. OW FreqOpt™: Bridging Data to Decisions
So, how is this theoretical framework put into practice? What sets OW FreqOpt™ apart is that it offers a closed-loop optimization approach that combines operational data with behavioral models. It integrates GTFS data, GPS streams, and passenger demand patterns into a Multi-Objective Optimization algorithm. This structure is designed to scale for real-time decision-making, even under high-volume data flows.
Our system doesn't just reduce "dead mileage"; it also:
Intelligent Fleet Allocation: Prioritizes vehicles with high PCI scores (newer/well-maintained) for routes with the highest demand and stress scores.
Dynamic Scheduling: Adapts service frequency to demand fluctuations before passenger build-up occurs, using RL-based predictive models.
Geographic Sensitivity: Bases stop locations not on "paper proximity" but on the passenger's actual "willingness to walk."
💡 3 Critical Actions for Decision Makers
| Action | What to Do | Why |
|---|---|---|
| Measure Perceptual Cost | Incorporate passenger comfort (PCI) into your models | Comfort perception reduces "perceived wait time," increasing satisfaction. |
| Manage Demand, Not Just Supply | Implement RL-based dynamic incentive systems (carbon credits, etc.) | Manage capacity through behavioral guidance rather than buying new buses. |
| Embrace Geographic Reality | Use a "slope penalty" in stop planning | A stop that looks close on paper can feel "far" when uphill. |
🎯 Conclusion: Human-Centric Decision Science

Public transport optimization is no longer just about reducing "empty kilometers." It's about combining the passenger's gaze patterns, the city's topography, and the power of digital incentives. With OW FreqOpt™, we optimize not just datasets, but how people perceive and interact with the system.
The transportation systems of the future will not be those that run more vehicles, but those that manage passenger behavior more intelligently.
It is possible to raise service quality without adding capacity in your city. Let's show you how.
Meet Decision Science: Request a Demo Now | Explore OW FreqOpt™ Solutions | Learn About the 12-Week Pilot
Related Content
Related Posts
Continue with adjacent topics—from mixed-integer programming (MIP) and combinatorial optimization to multi-objective scenario modeling in public transit.
What People Actually Expect from Public Transport (And Why It's Still Not Being Met)
IPPR research applied to Turkey: passengers expect reliability, affordability, and safety. How OW GTFSHub™, CostLogic™, and FreqOpt™ help municipalities meet those expectations.
How to Build a Public Transport Network in Strategy Games? Real-World Optimization
Stop traffic meltdown in Cities: Skylines–style games: headways, hub-and-spoke, dead mileage, and GTFS-grade thinking—bridging games and real transit optimization.