Skip to content

DECISION SCENARIOS

Different challenges. One decision platform.

Public Transit Use Cases | Network & Budget Optimization

Every transit agency faces different questions. The underlying system is often the same.

What keeps transit agencies from reaching their full potential — and how do network performance, budgets, and equity connect?

OW supports organizations in turning operational questions into structured, explainable, and improvable solutions.

Better operations begin with better questions.

OW turns those questions into measurable, explainable decisions.

FEATURED

System Question

Why does the network underperform despite planned supply?

Because

Why are buses running empty — while riders wait?

OW discovers

  • Demand–supply mismatches across time and space
  • Structural drivers of empty kilometers
  • System-level causes of delays and crowding
View case
OW Optimize the World — tram arriving at a platform for network performance
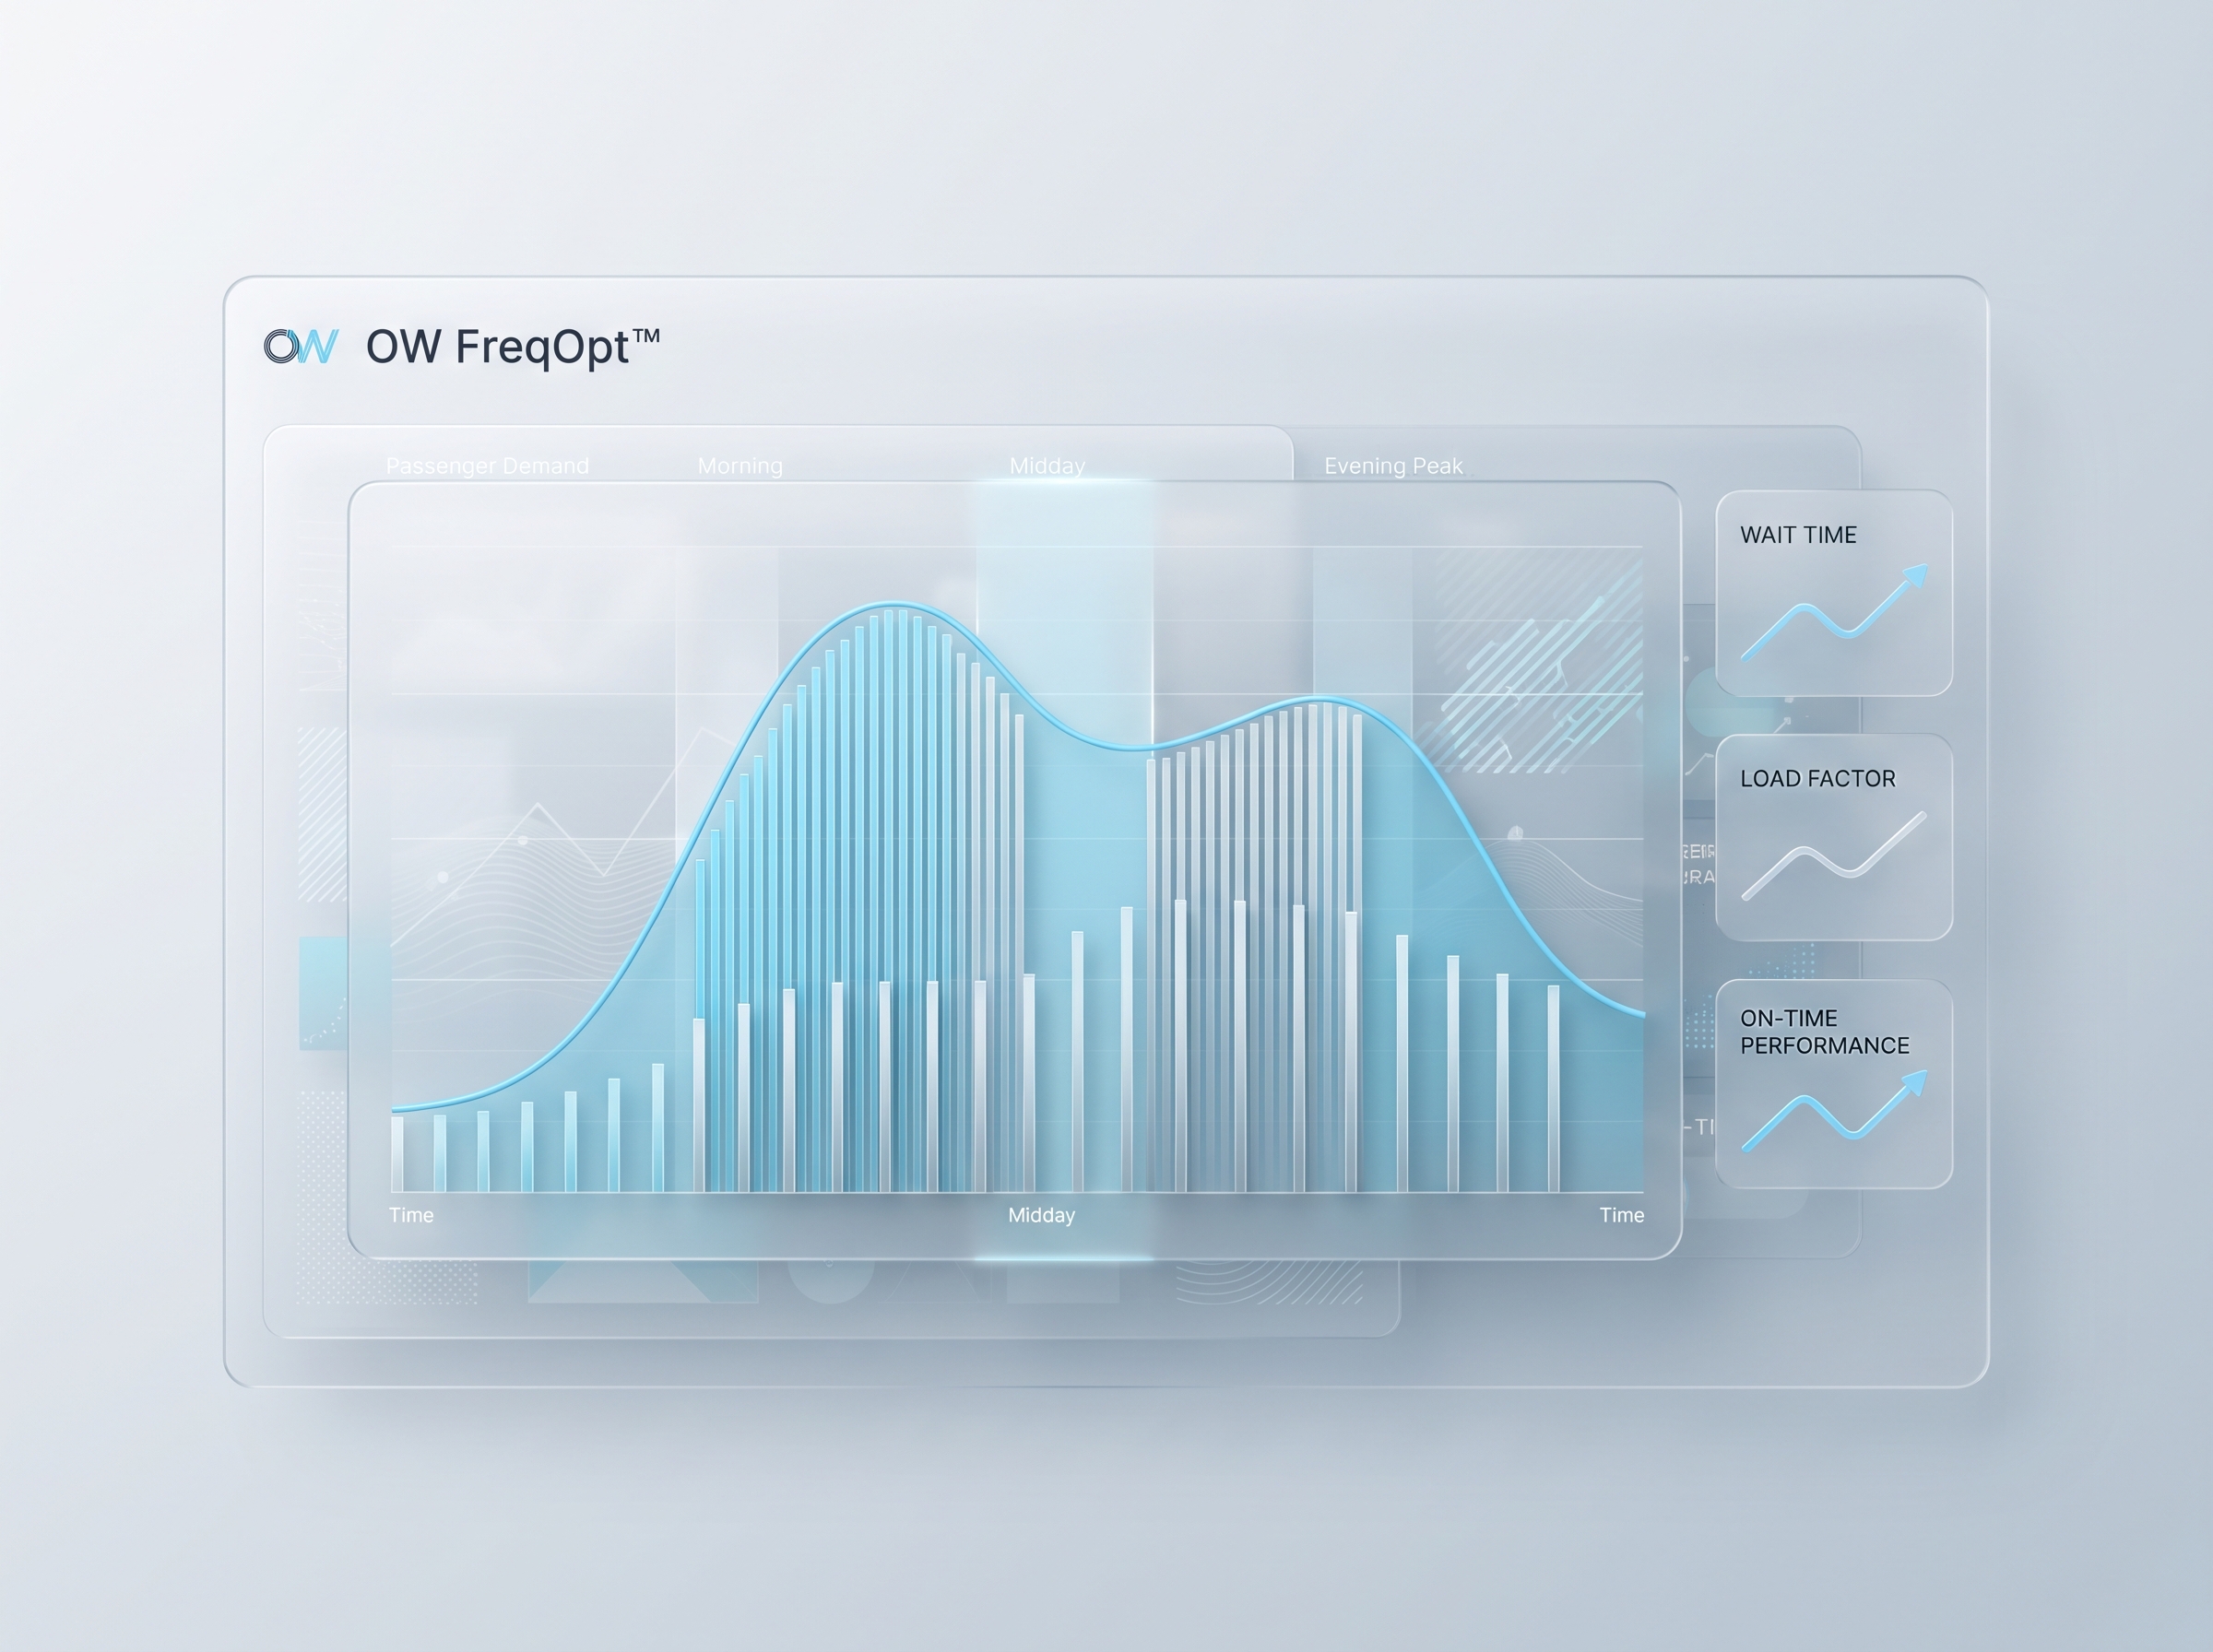
In OW SuiteOW FreqOpt™
OW FreqOpt™

MEASURED OUTCOMES

View Case Study

20%

lower operating cost

18%

lower dead mileage

94%

schedule stability

100%

labor compliance

Indicative ranges from OW optimization scenarios — see Case Studies for detail.

How OW Suite Transforms Transit Operations

Public transit agencies worldwide must improve reliability and rider experience while operating under strict fiscal and environmental constraints. Effective public transit optimization goes beyond static timetables: it requires decision intelligence that unifies data from operations, planning, and finance. OW Suite addresses this need by modeling how service changes affect network efficiency, costs, and communities together. Agencies use it to move from reactive firefighting to proactive planning—grounded in evidence about performance, budget alignment, and outcomes riders actually experience.

Network Performance Optimization

Network performance optimization begins with seeing the system as a whole. When routes, depots, and peaks are optimized in isolation, hidden inefficiencies accumulate—extra dead mileage, unstable headways, and crowding that spreadsheets underestimate. OW Suite applies optimization and analytics across the network so planners can target interventions that improve punctuality and capacity where demand is concentrated, while preserving stability across the day. The goal is sustainable network efficiency: better service per vehicle-hour, not simply more vehicles on the street.
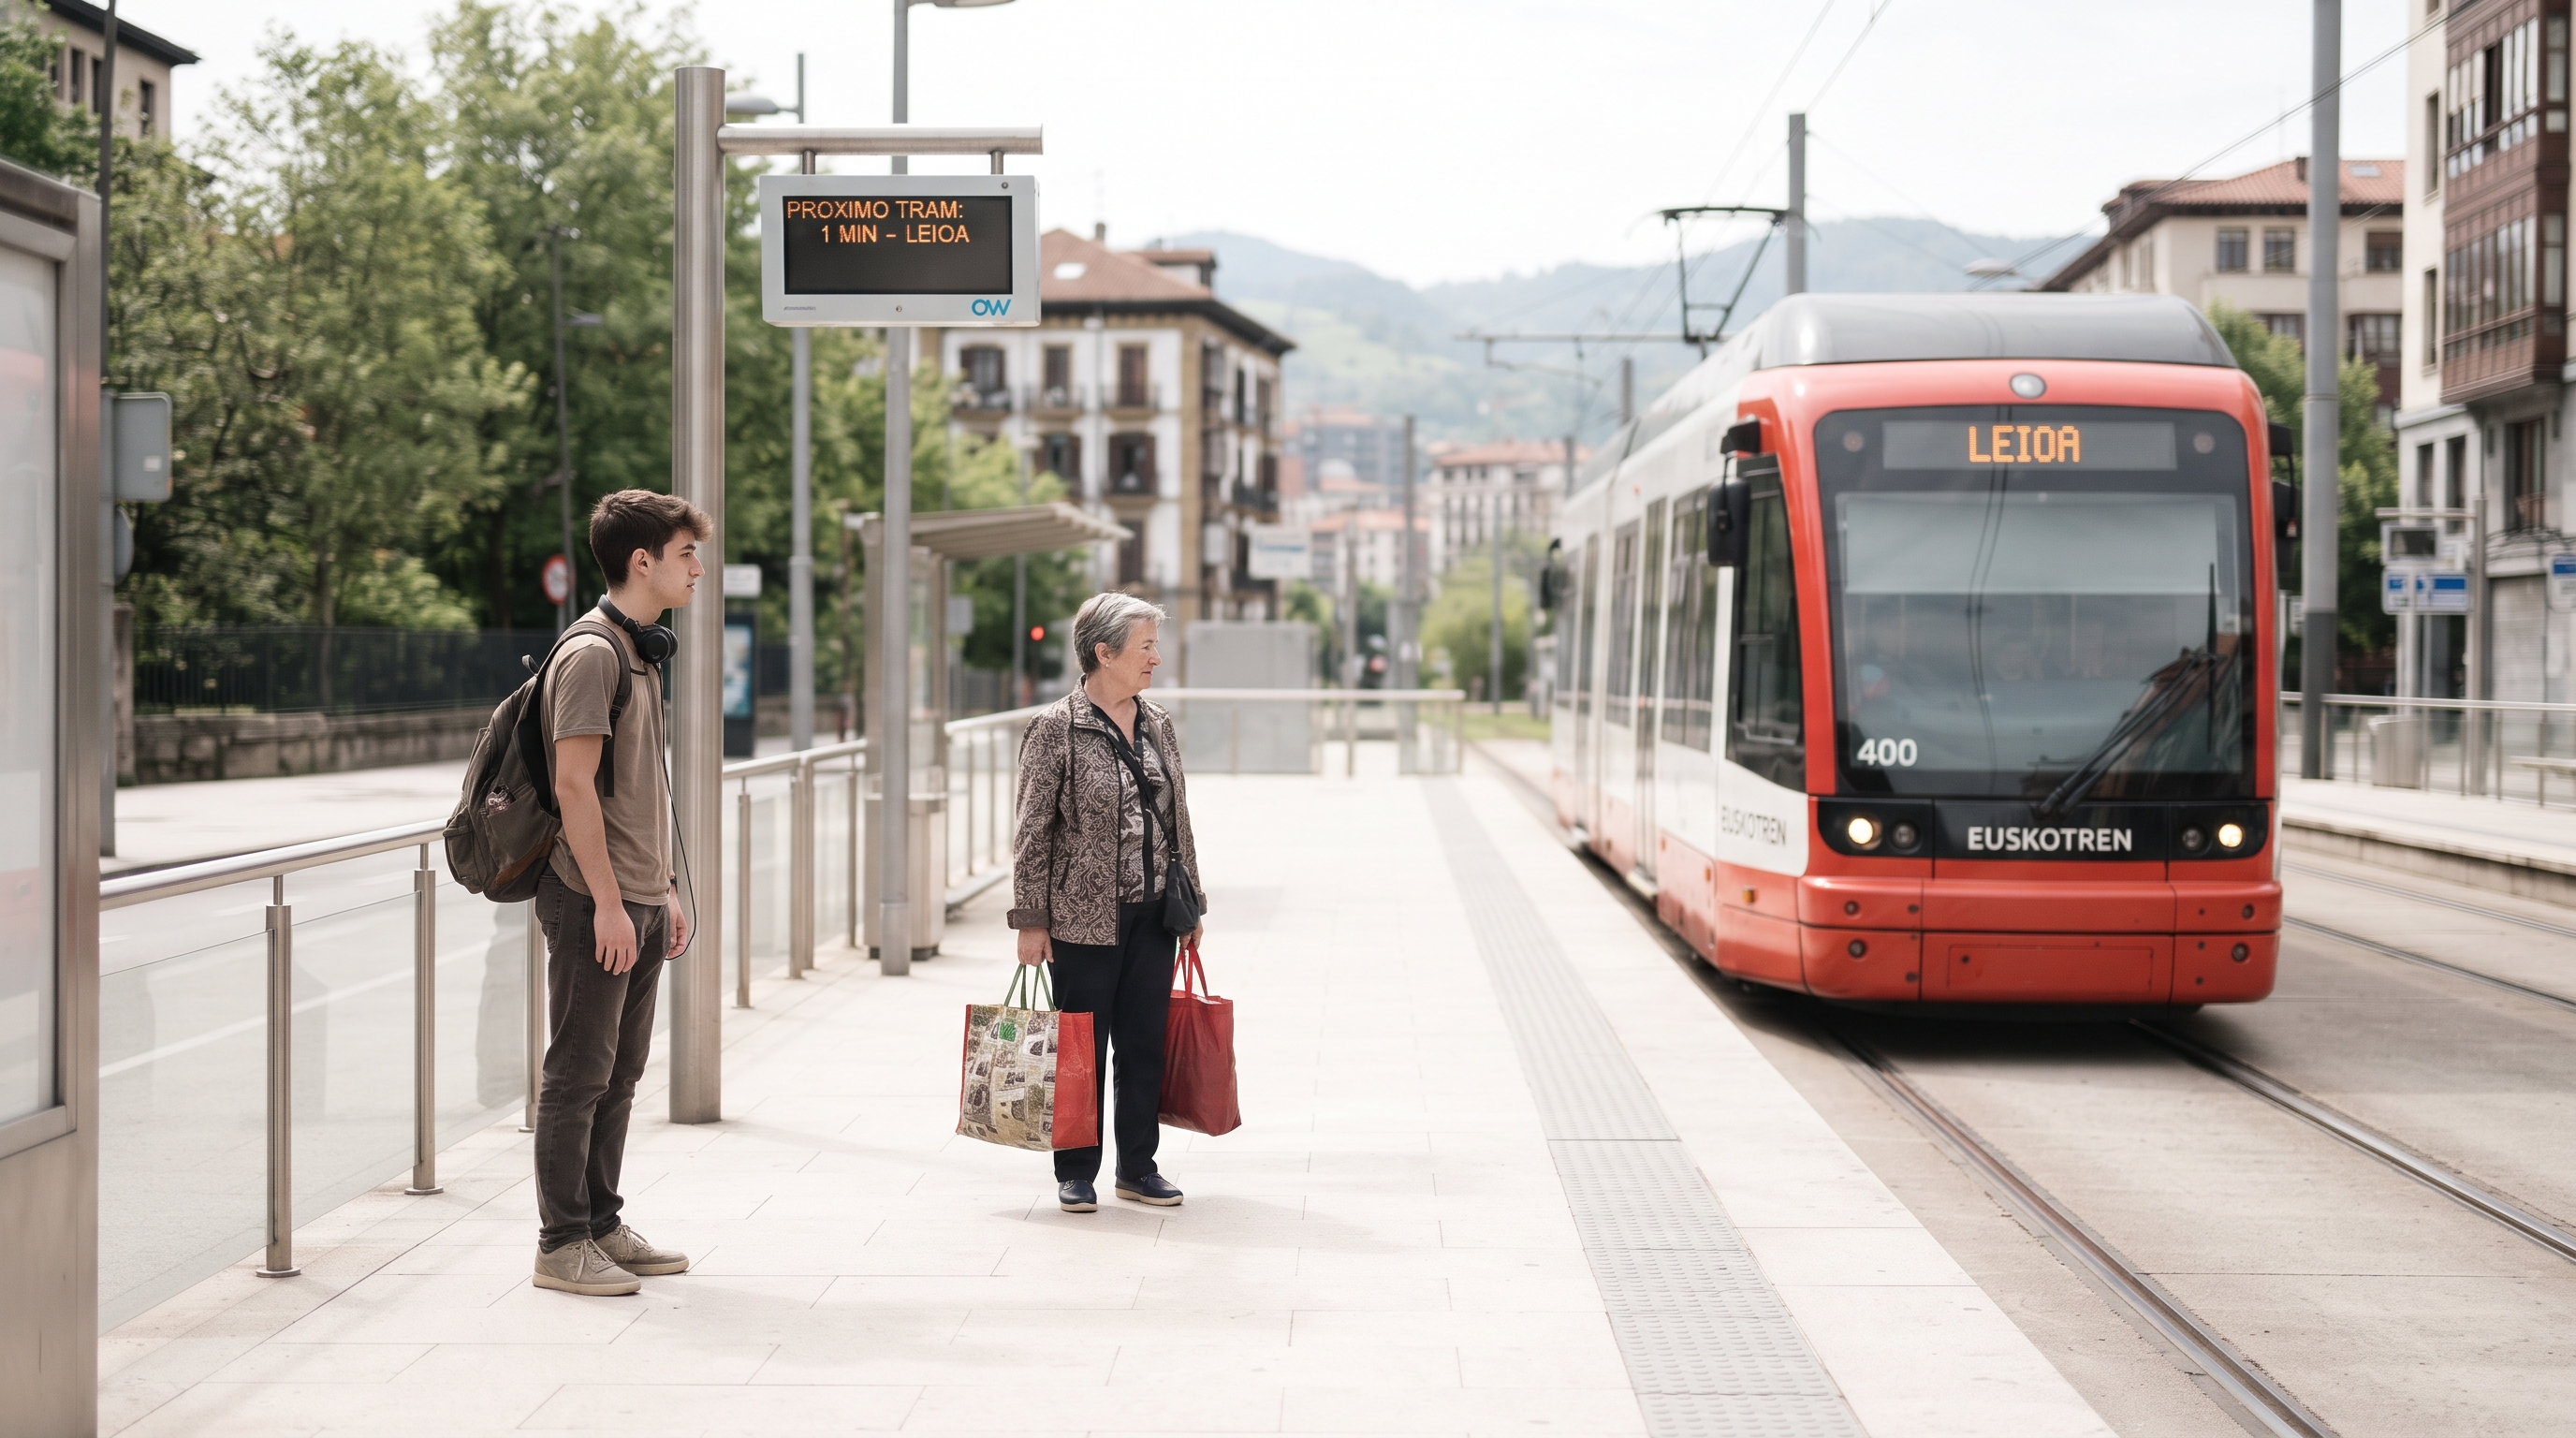
OW Optimize the World — tram arriving at a platform for network performance

Budget & Cost Dynamics

Budget and cost dynamics are inseparable from operational design. Which costs are fixed by infrastructure and which flex with scheduling choices? OW Suite helps teams connect GTFS-based service plans to operating expenditure drivers, so budget alignment becomes a shared language between finance and operations. Scenario comparison clarifies where savings are durable and where they depend on maintaining specific frequencies or labor rules—reducing the risk of “paper” savings that disappear in daily execution.

OW Optimize the World — documentary urban transit scene for budget and cost decisions

Environmental Sustainability

Environmental sustainability is increasingly part of transit mandates. Empty kilometers, poor load factors, and stop-and-go patterns drive unnecessary emissions. OW Suite integrates environmental indicators with operational optimization so agencies can pursue CO₂ and fuel reductions alongside reliability targets. Decision intelligence reveals which levers—interlining, depot assignment, frequency tuning—deliver the strongest environmental return without undermining equity or service quality.

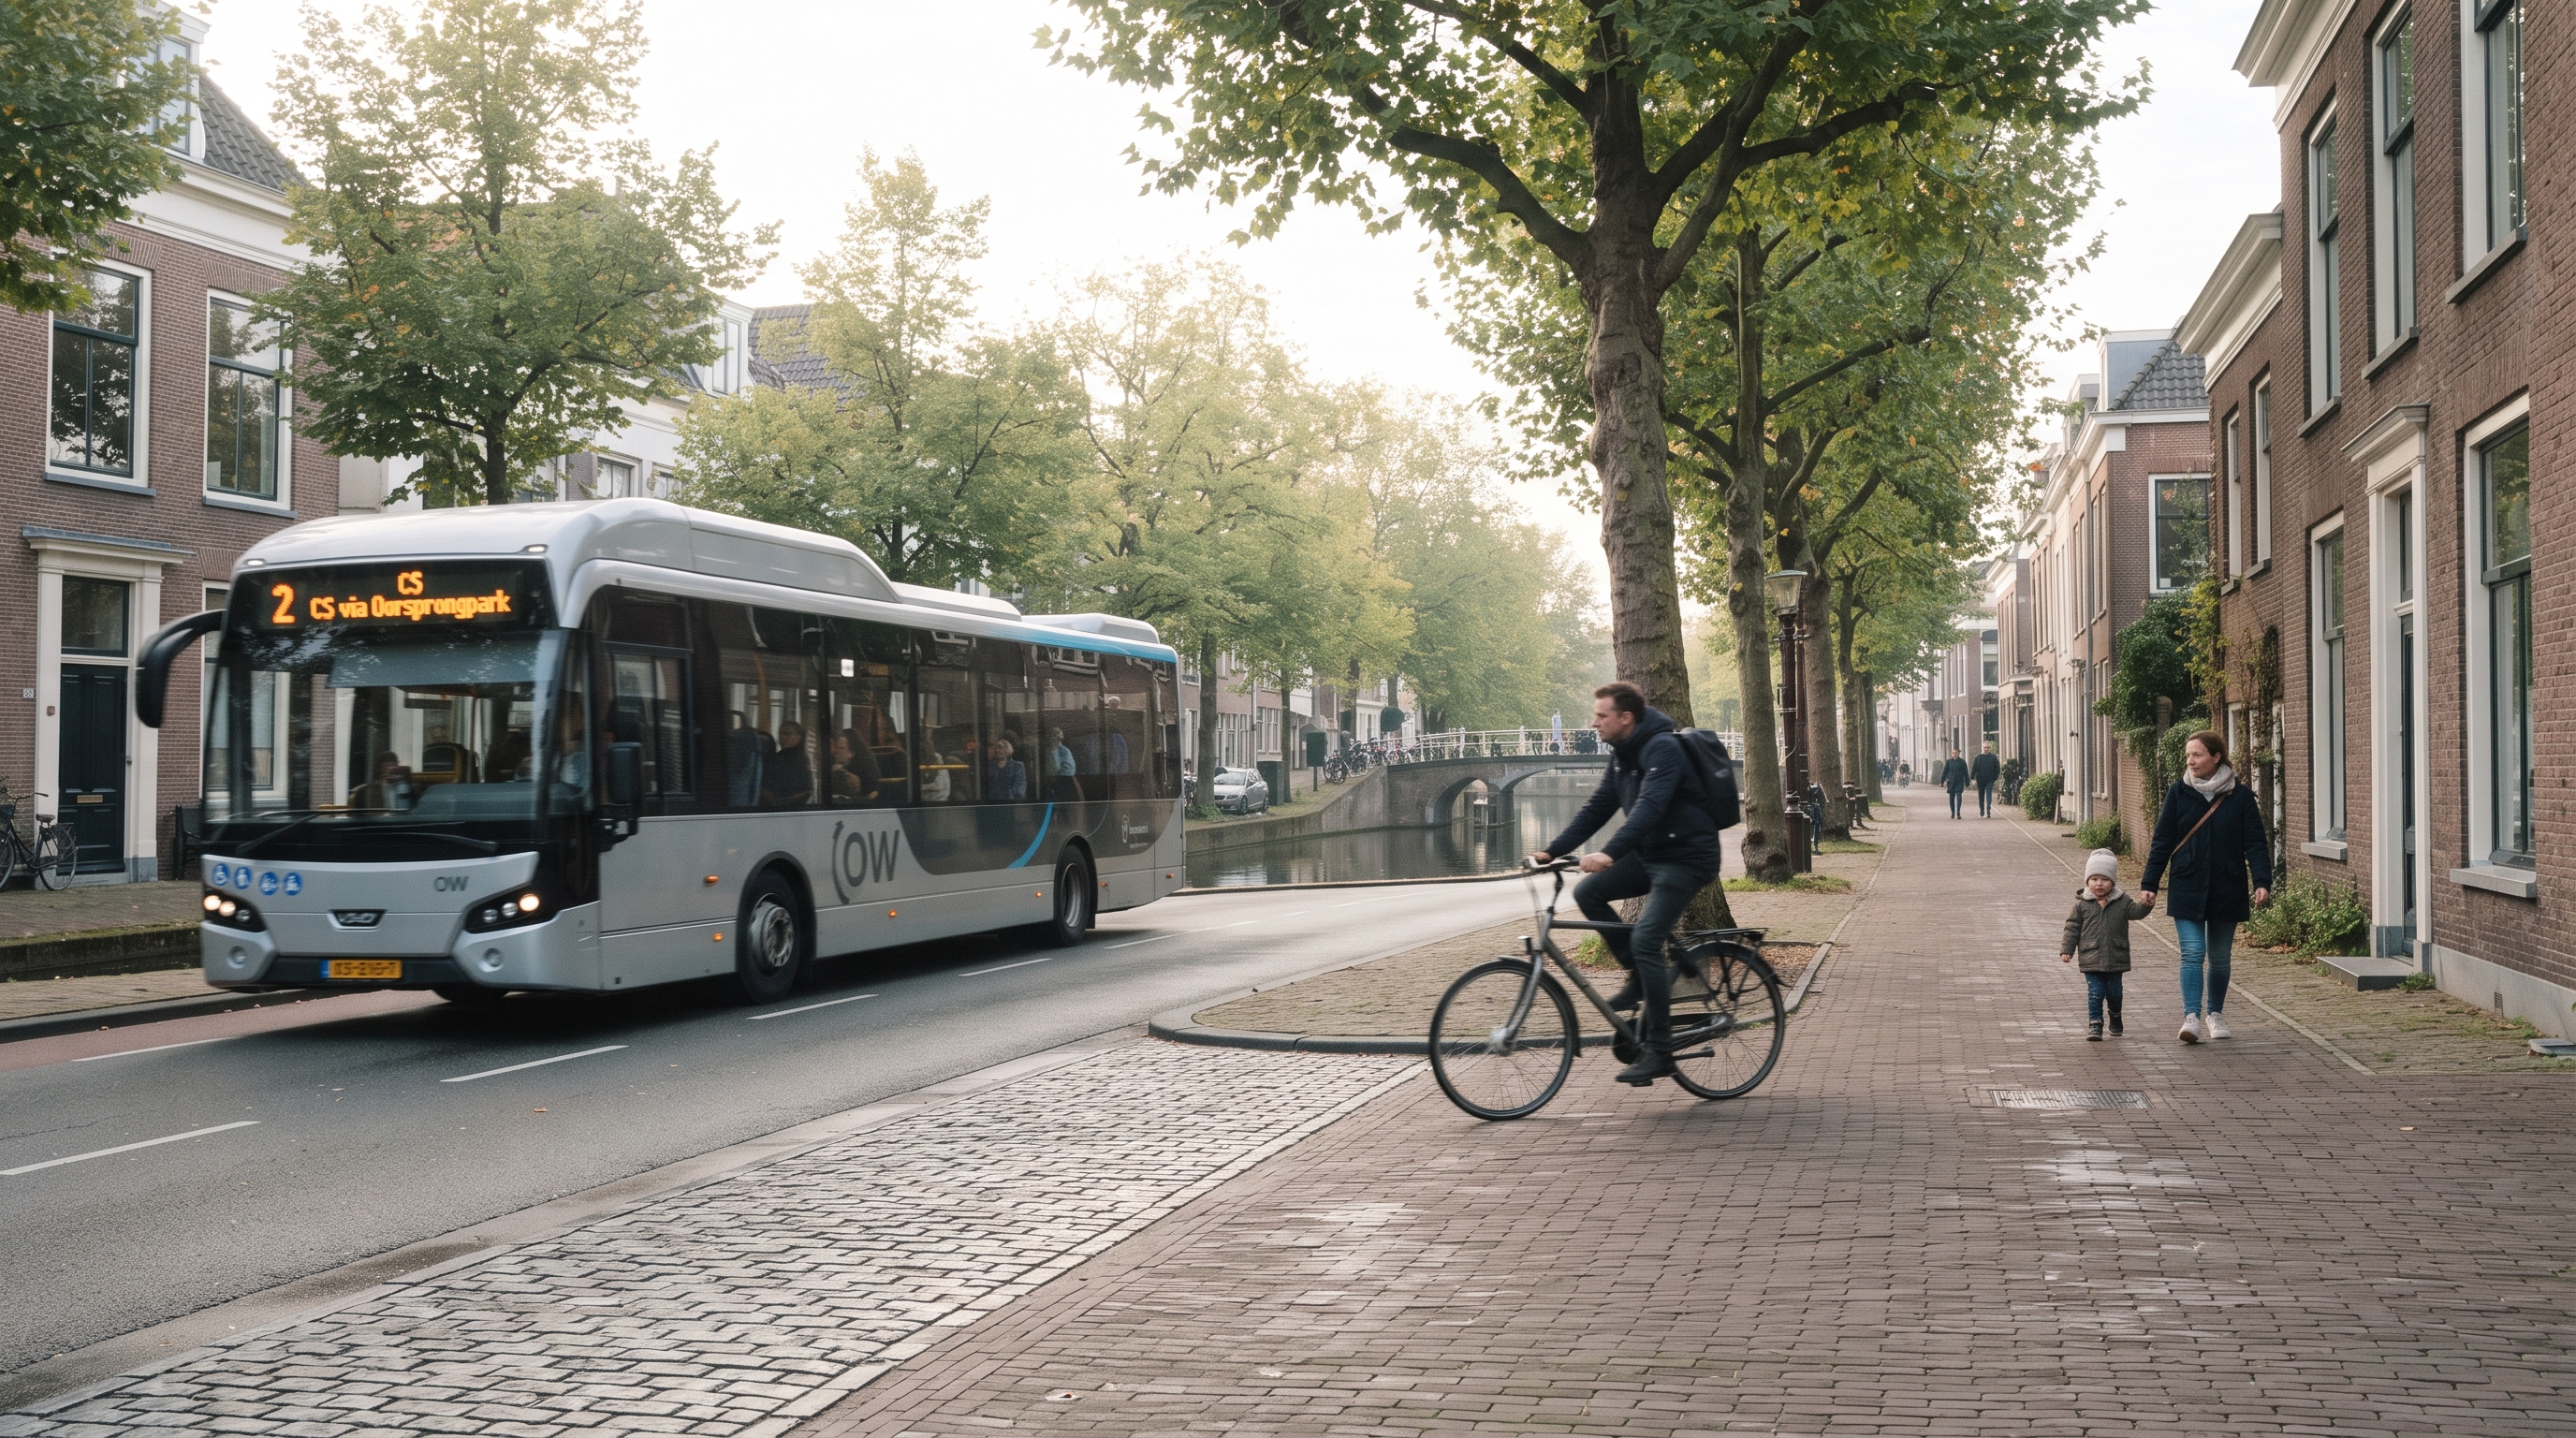
OW Optimize the World — electric bus and cyclist illustrating sustainable mobility

Equity & Accessibility

Equity and accessibility require that benefits and burdens of service changes are visible across neighborhoods and rider groups. Average metrics can mask gaps in coverage or reliability for vulnerable communities. OW Suite supports equity-focused analysis so planners can test how proposed changes affect access to jobs, education, and healthcare. Pairing equity goals with budget alignment and network efficiency helps agencies justify investments that expand fair access while staying within financial guardrails.

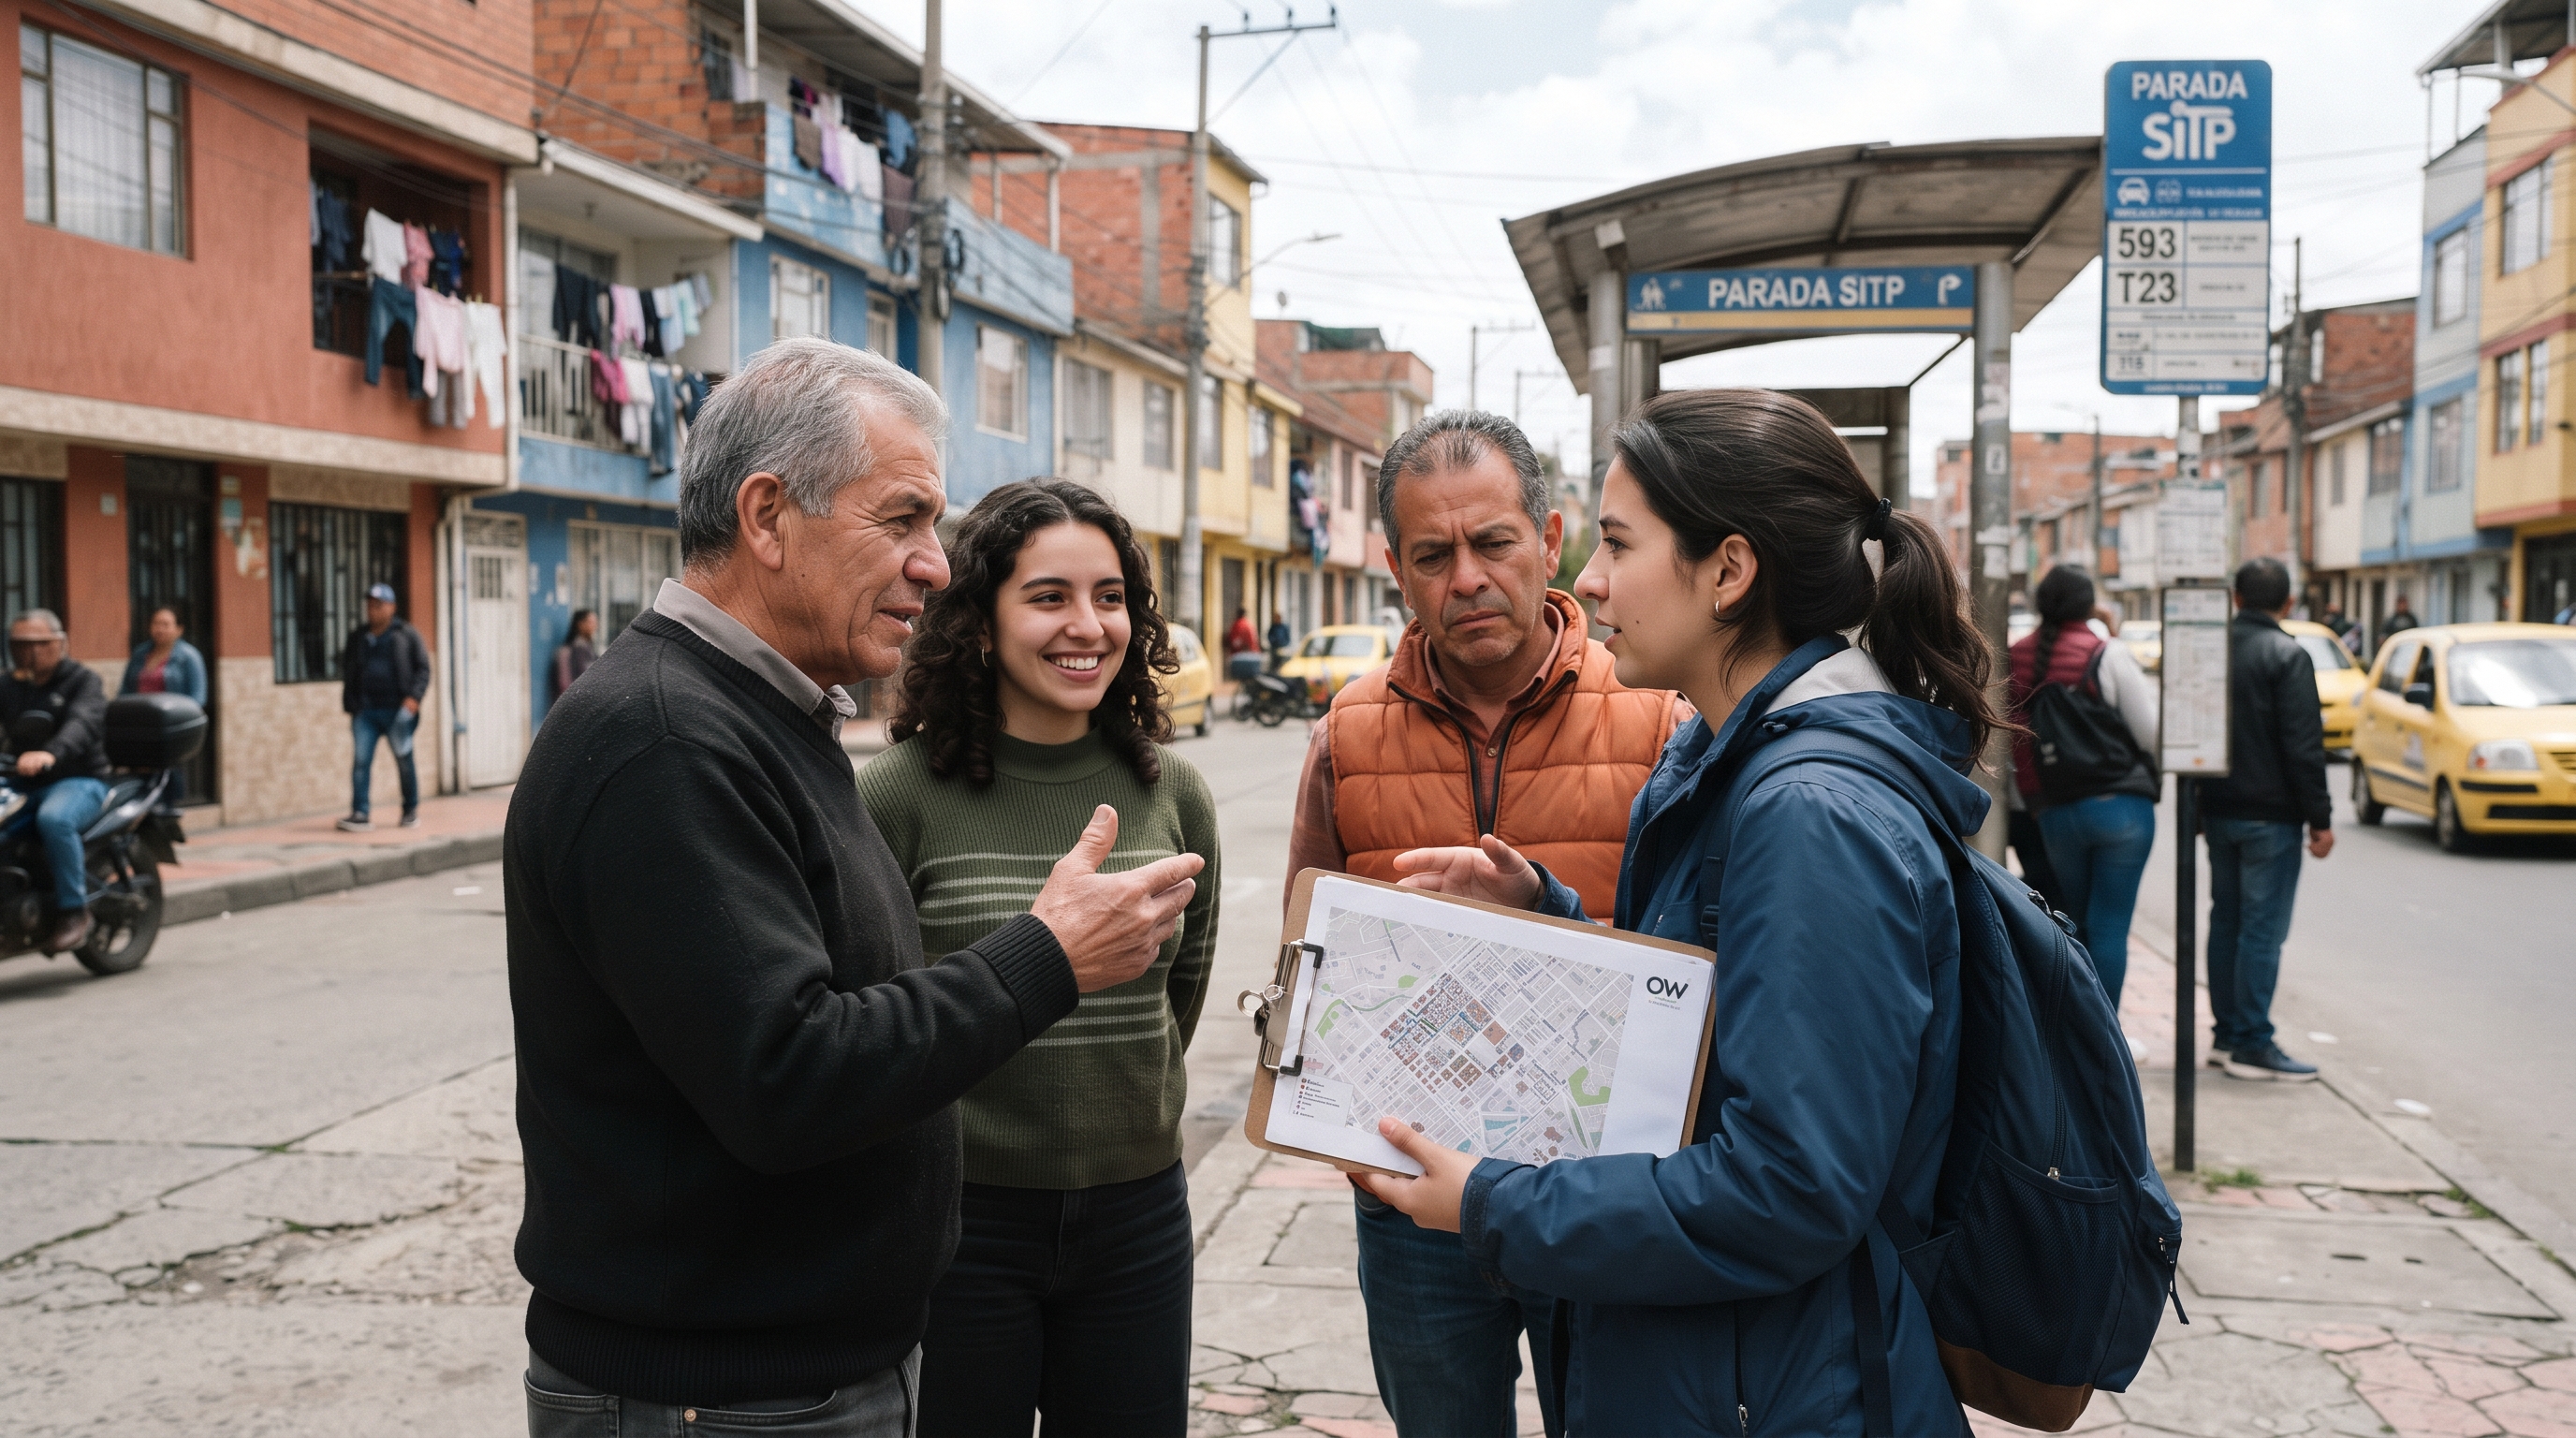
OW Optimize the World — outdoor community meeting on city planning and equity

CITYWIDE OPERATIONS & GOVERNANCE

Why do citywide decisions keep missing the system?

System Question

How can limited resources be allocated across the city?

What OW Helps Uncover

  • Structural inefficiencies across departments
  • Hidden dependencies between operational units
  • Leverage points with the highest system-wide impact

Approach

OW integrates fragmented operational data into a shared system model, enabling organizations to understand trade-offs and coordinate actions across governance layers.

Technology

OW integrates fragmented GTFS feeds, AVL trajectories, and smart card transaction streams into a single optimization-ready dataset. Mixed-integer programming (MIP) exposes cross-department resource allocation trade-offs, while linked scenarios show how headway stability, deadhead ratios, and crowding signals respond to policy shifts before they reach riders.

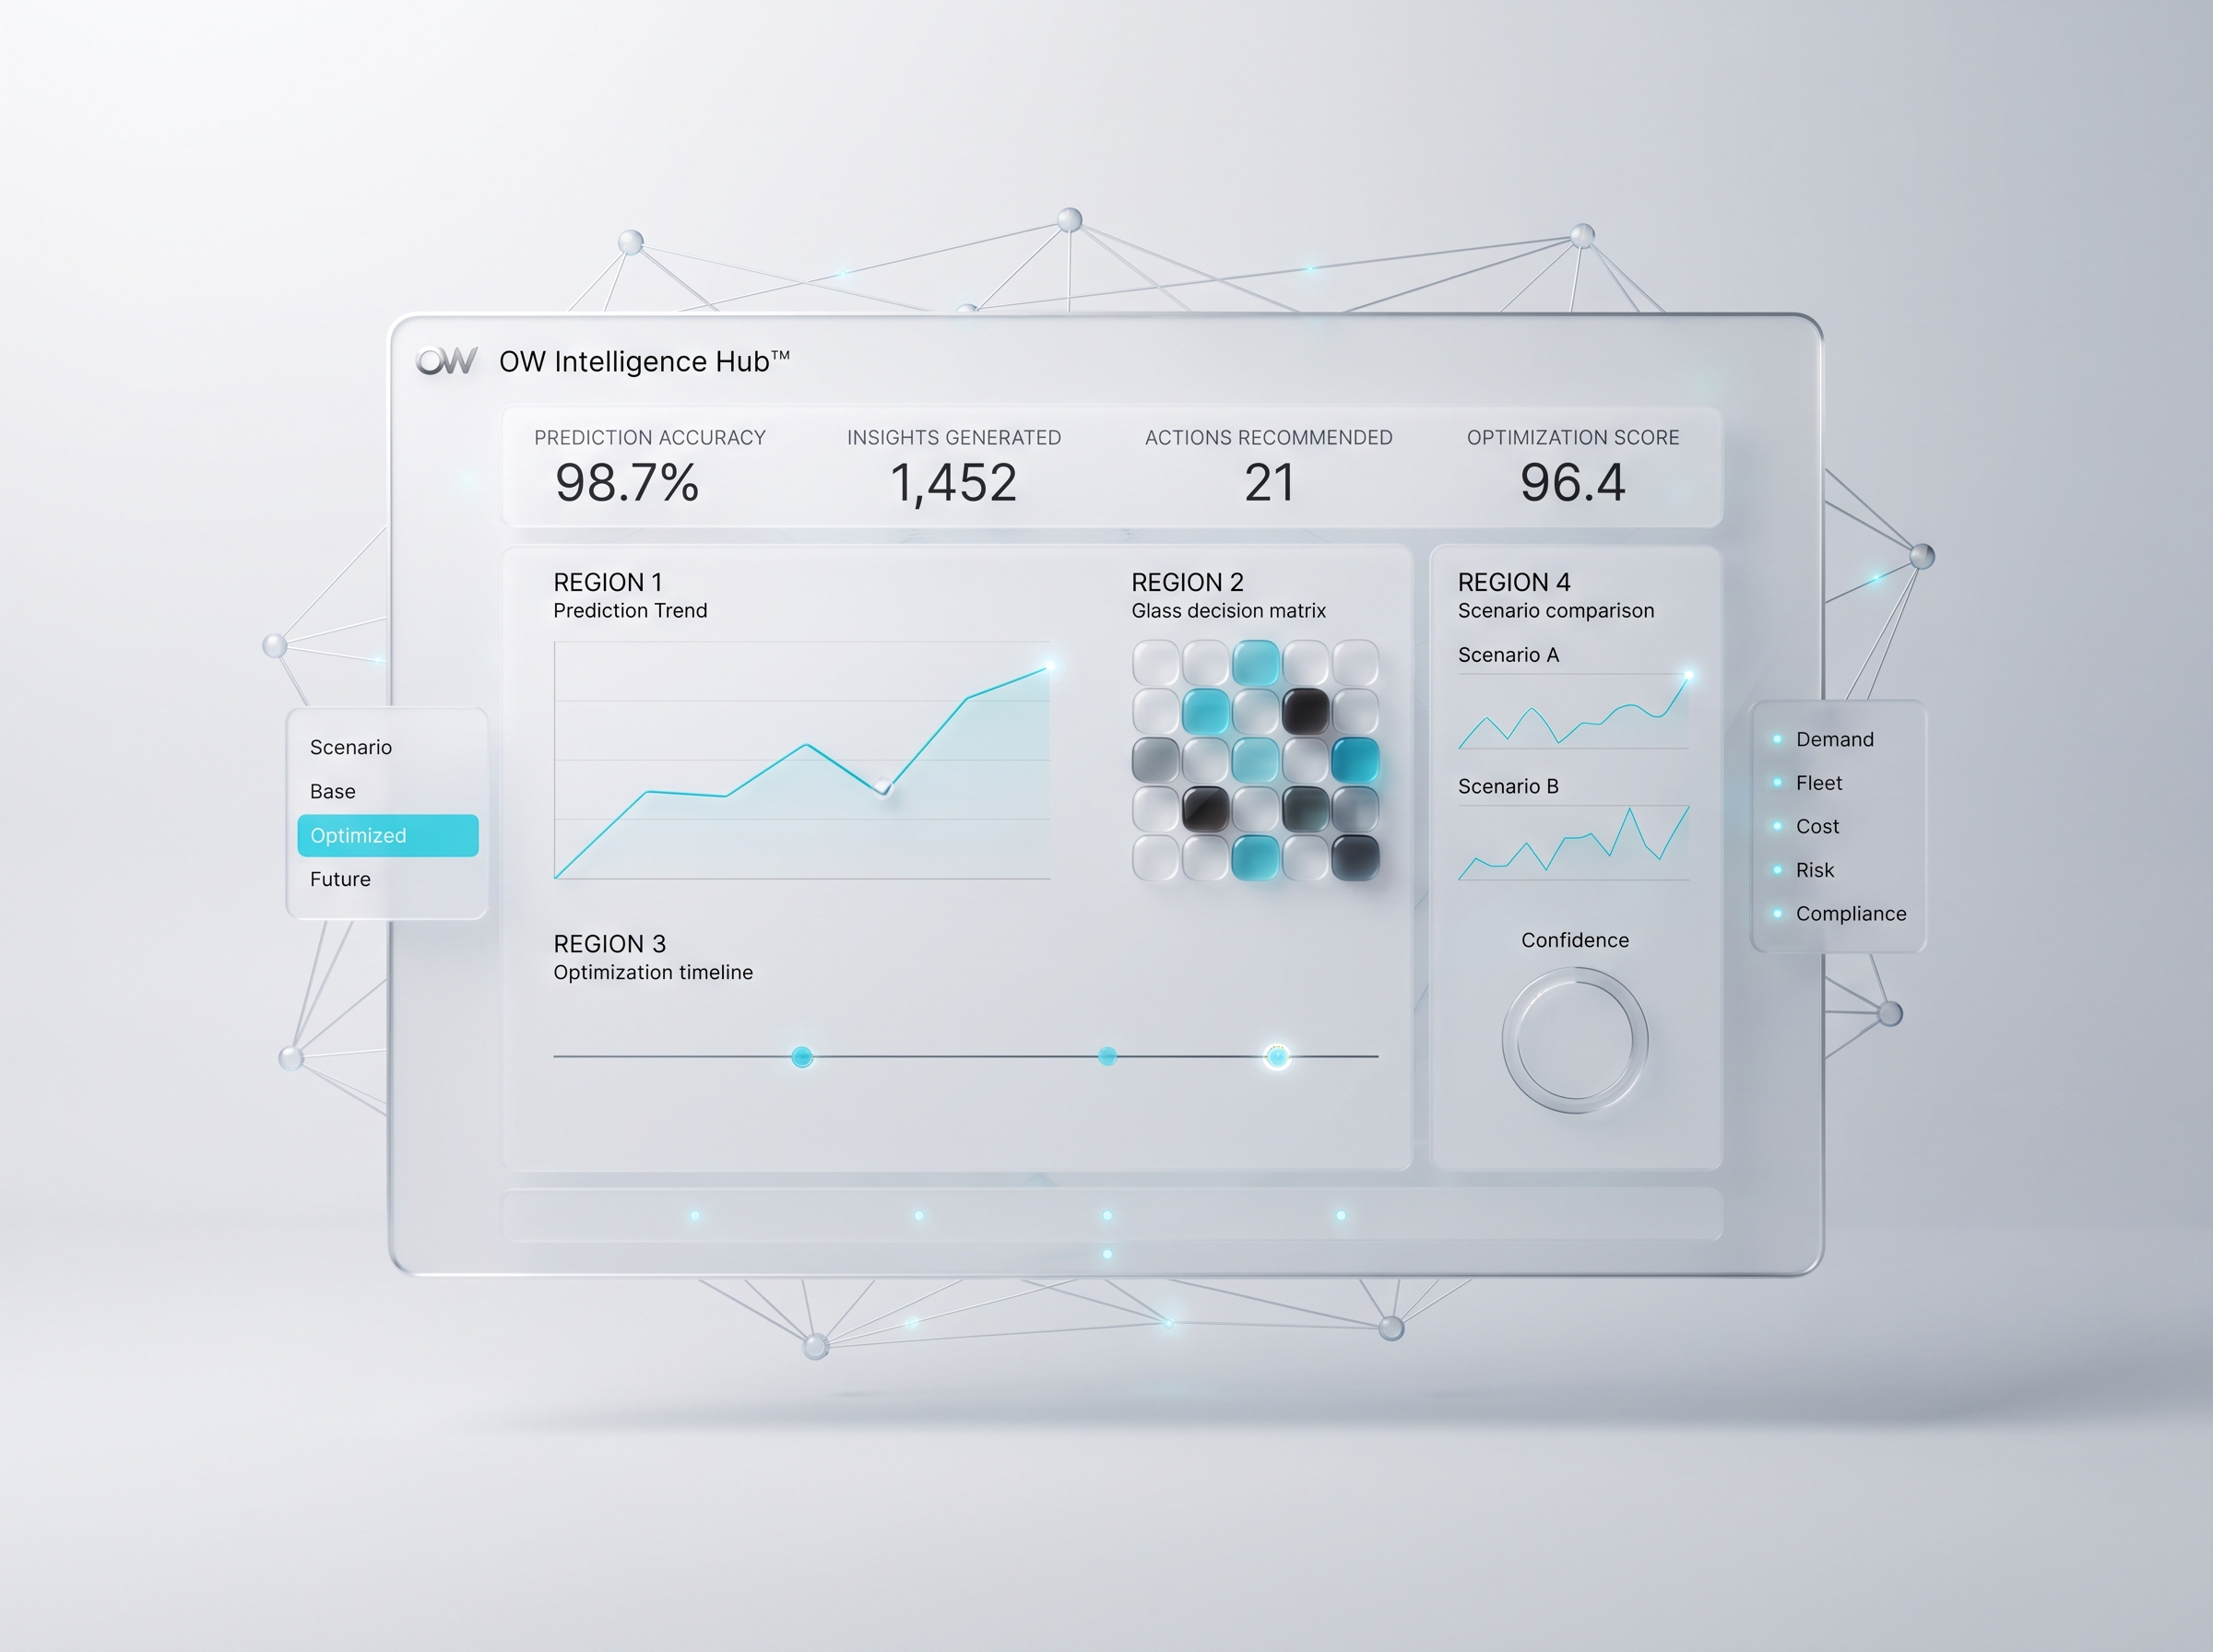
View Case StudyIn OW Suite: OW Intelligence Hub™
OW Optimize the World — city planners comparing network maps on a laptop
OW Intelligence Hub™In OW Suite
OW Intelligence Hub™

BUDGET & COST DYNAMICS

Where is the budget actually going?

System Question

Which costs are structural — and which come from choices?

What OW Helps Uncover

  • Fixed and variable cost behavior
  • Cost sensitivity to planning and operational decisions
  • Where savings are real — and where they only appear so

Approach

OW shifts budget discussions from totals to decision impact, helping organizations understand how choices translate into costs.

Technology

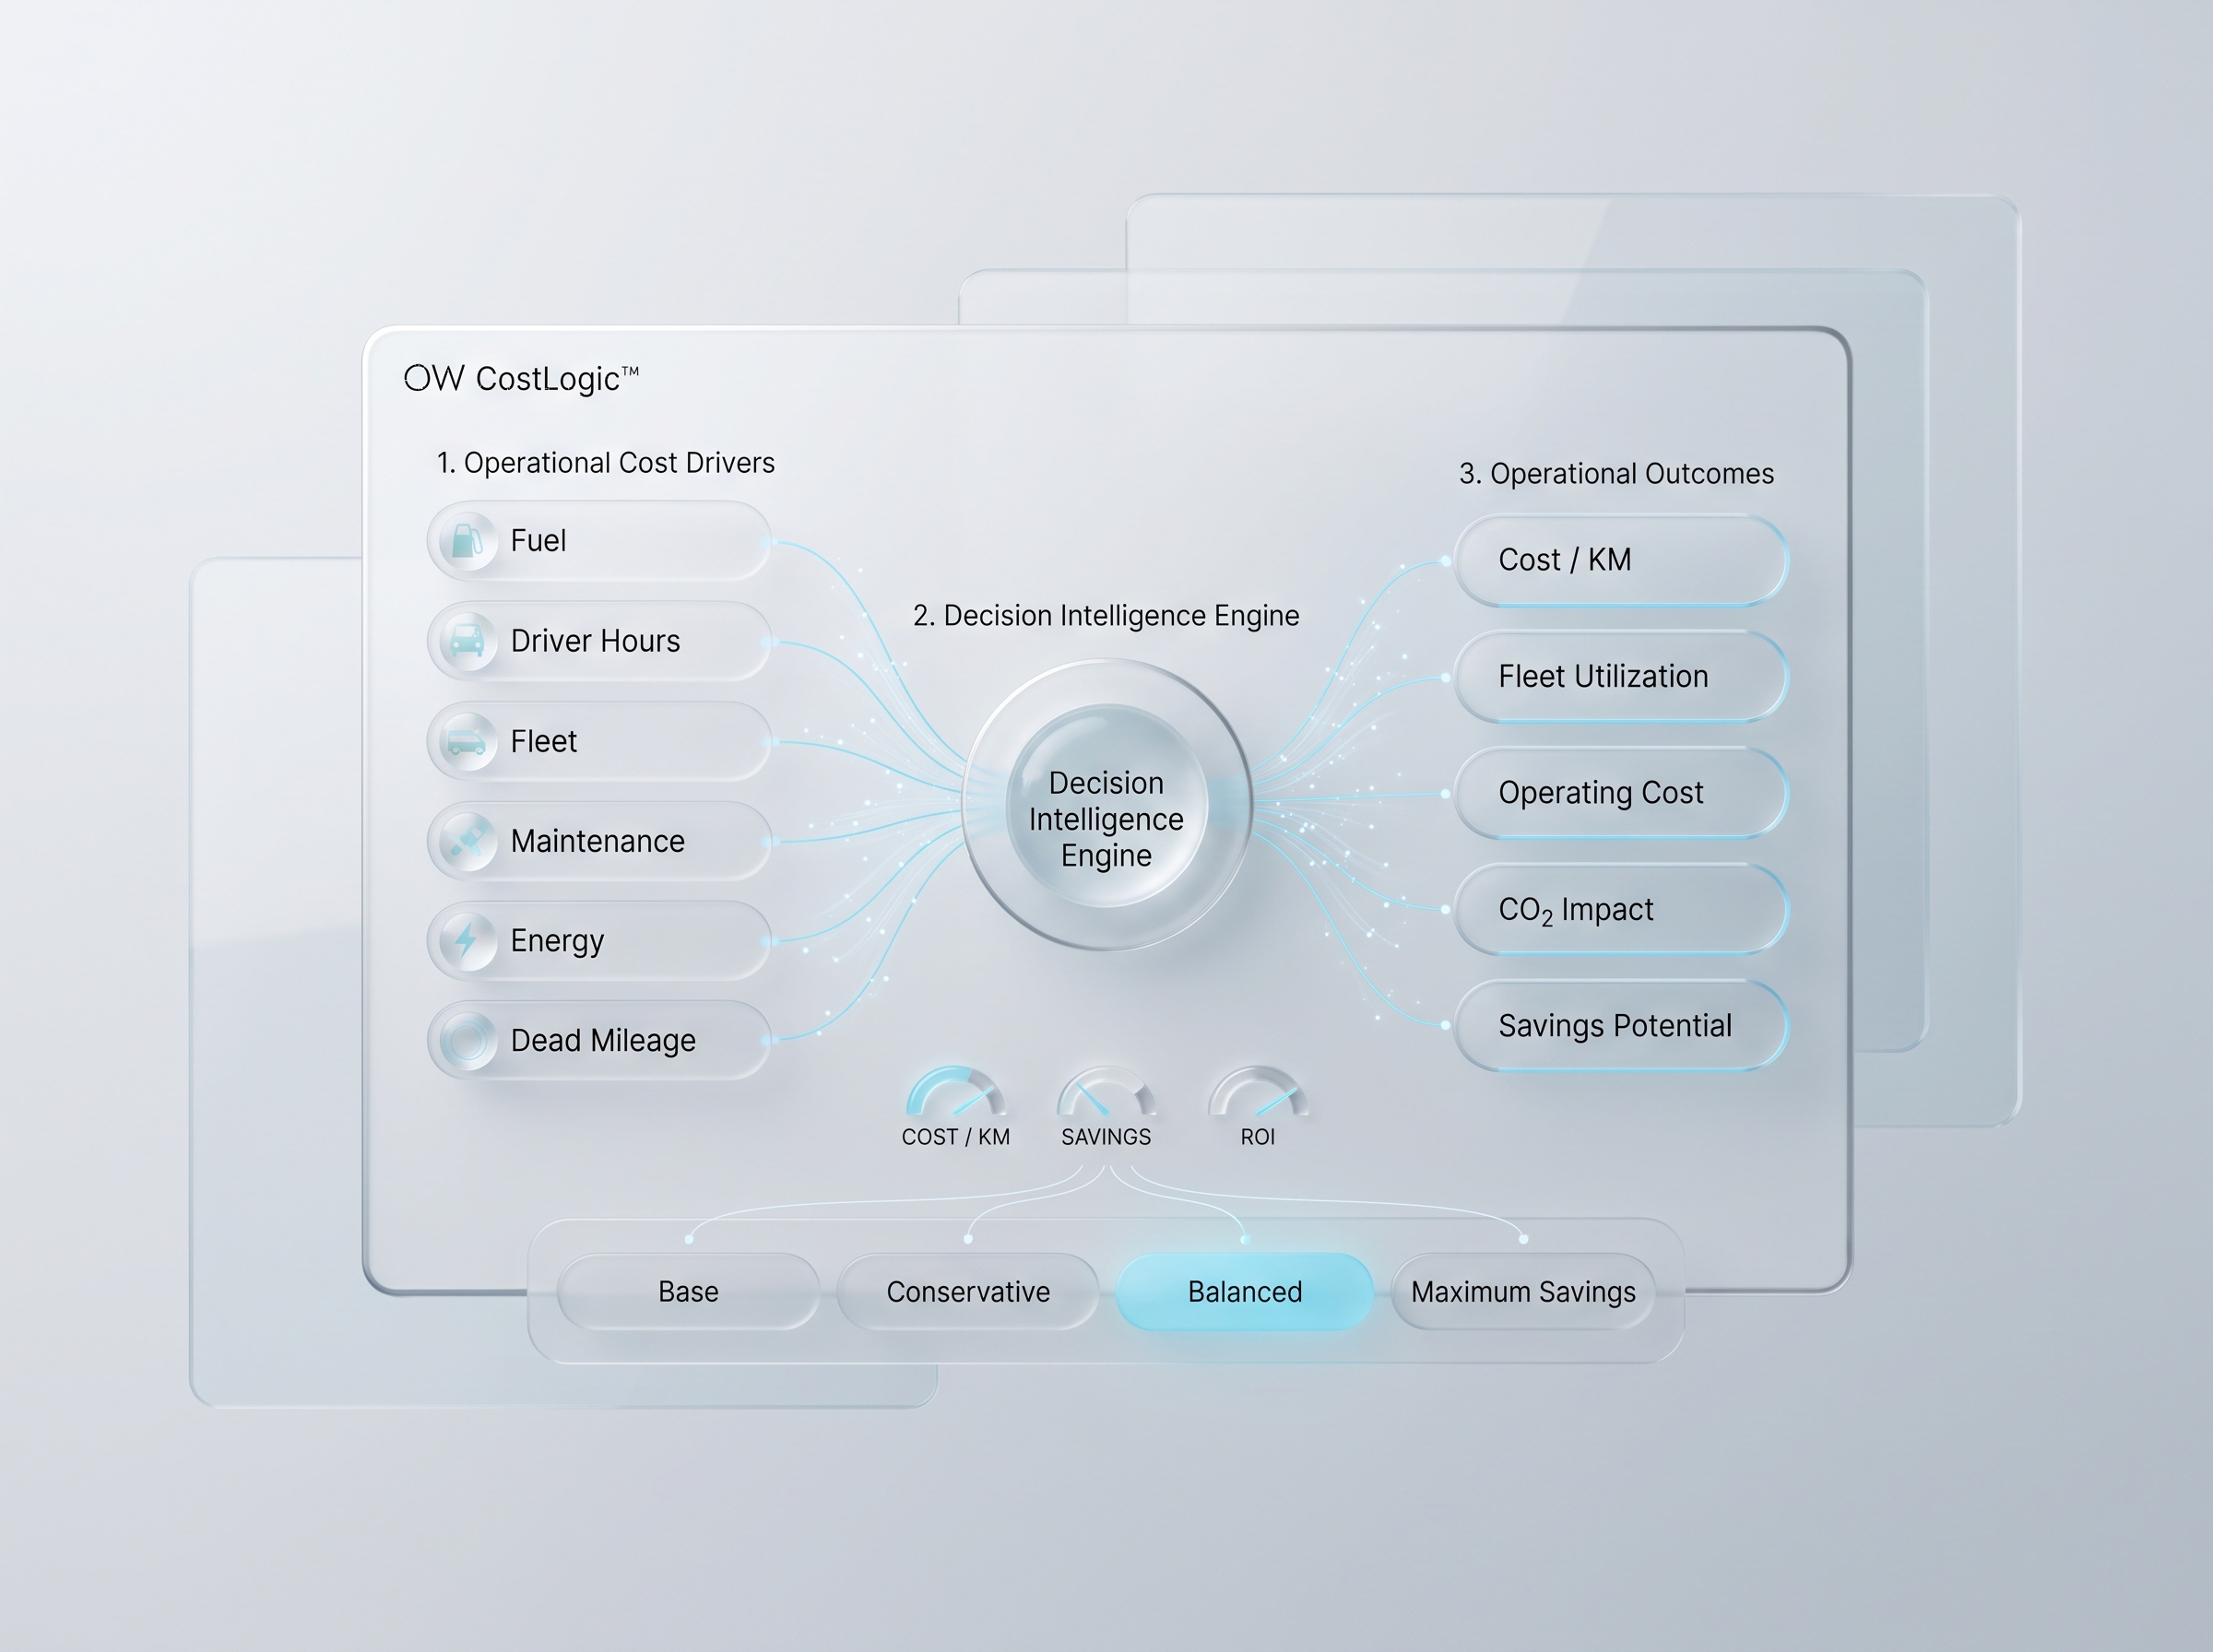
CostLogic-style decomposition separates fixed versus variable cost drivers tied to fleet cycles, crew rules, and energy use. Scenario runs connect GTFS-based service levels to OPEX sensitivity, helping finance teams see where savings are structural versus where they depend on maintaining specific headways or depot policies.

View Case StudyIn OW Suite: OW CostLogic™
OW Optimize the World — documentary urban transit scene for budget and cost decisions
OW CostLogic™In OW Suite
OW CostLogic™

ENVIRONMENTAL PERFORMANCE & SUSTAINABILITY

Can we cut emissions without cutting service?

System Question

How do operational choices influence environmental outcomes?

What OW Helps Uncover

  • Emission drivers embedded in routing and fleet logic
  • Trade-offs between service quality and sustainability
  • Decision points with the highest environmental leverage

Approach

OW aligns operational optimization with climate and sustainability objectives by making environmental impact a measurable system outcome.

Technology

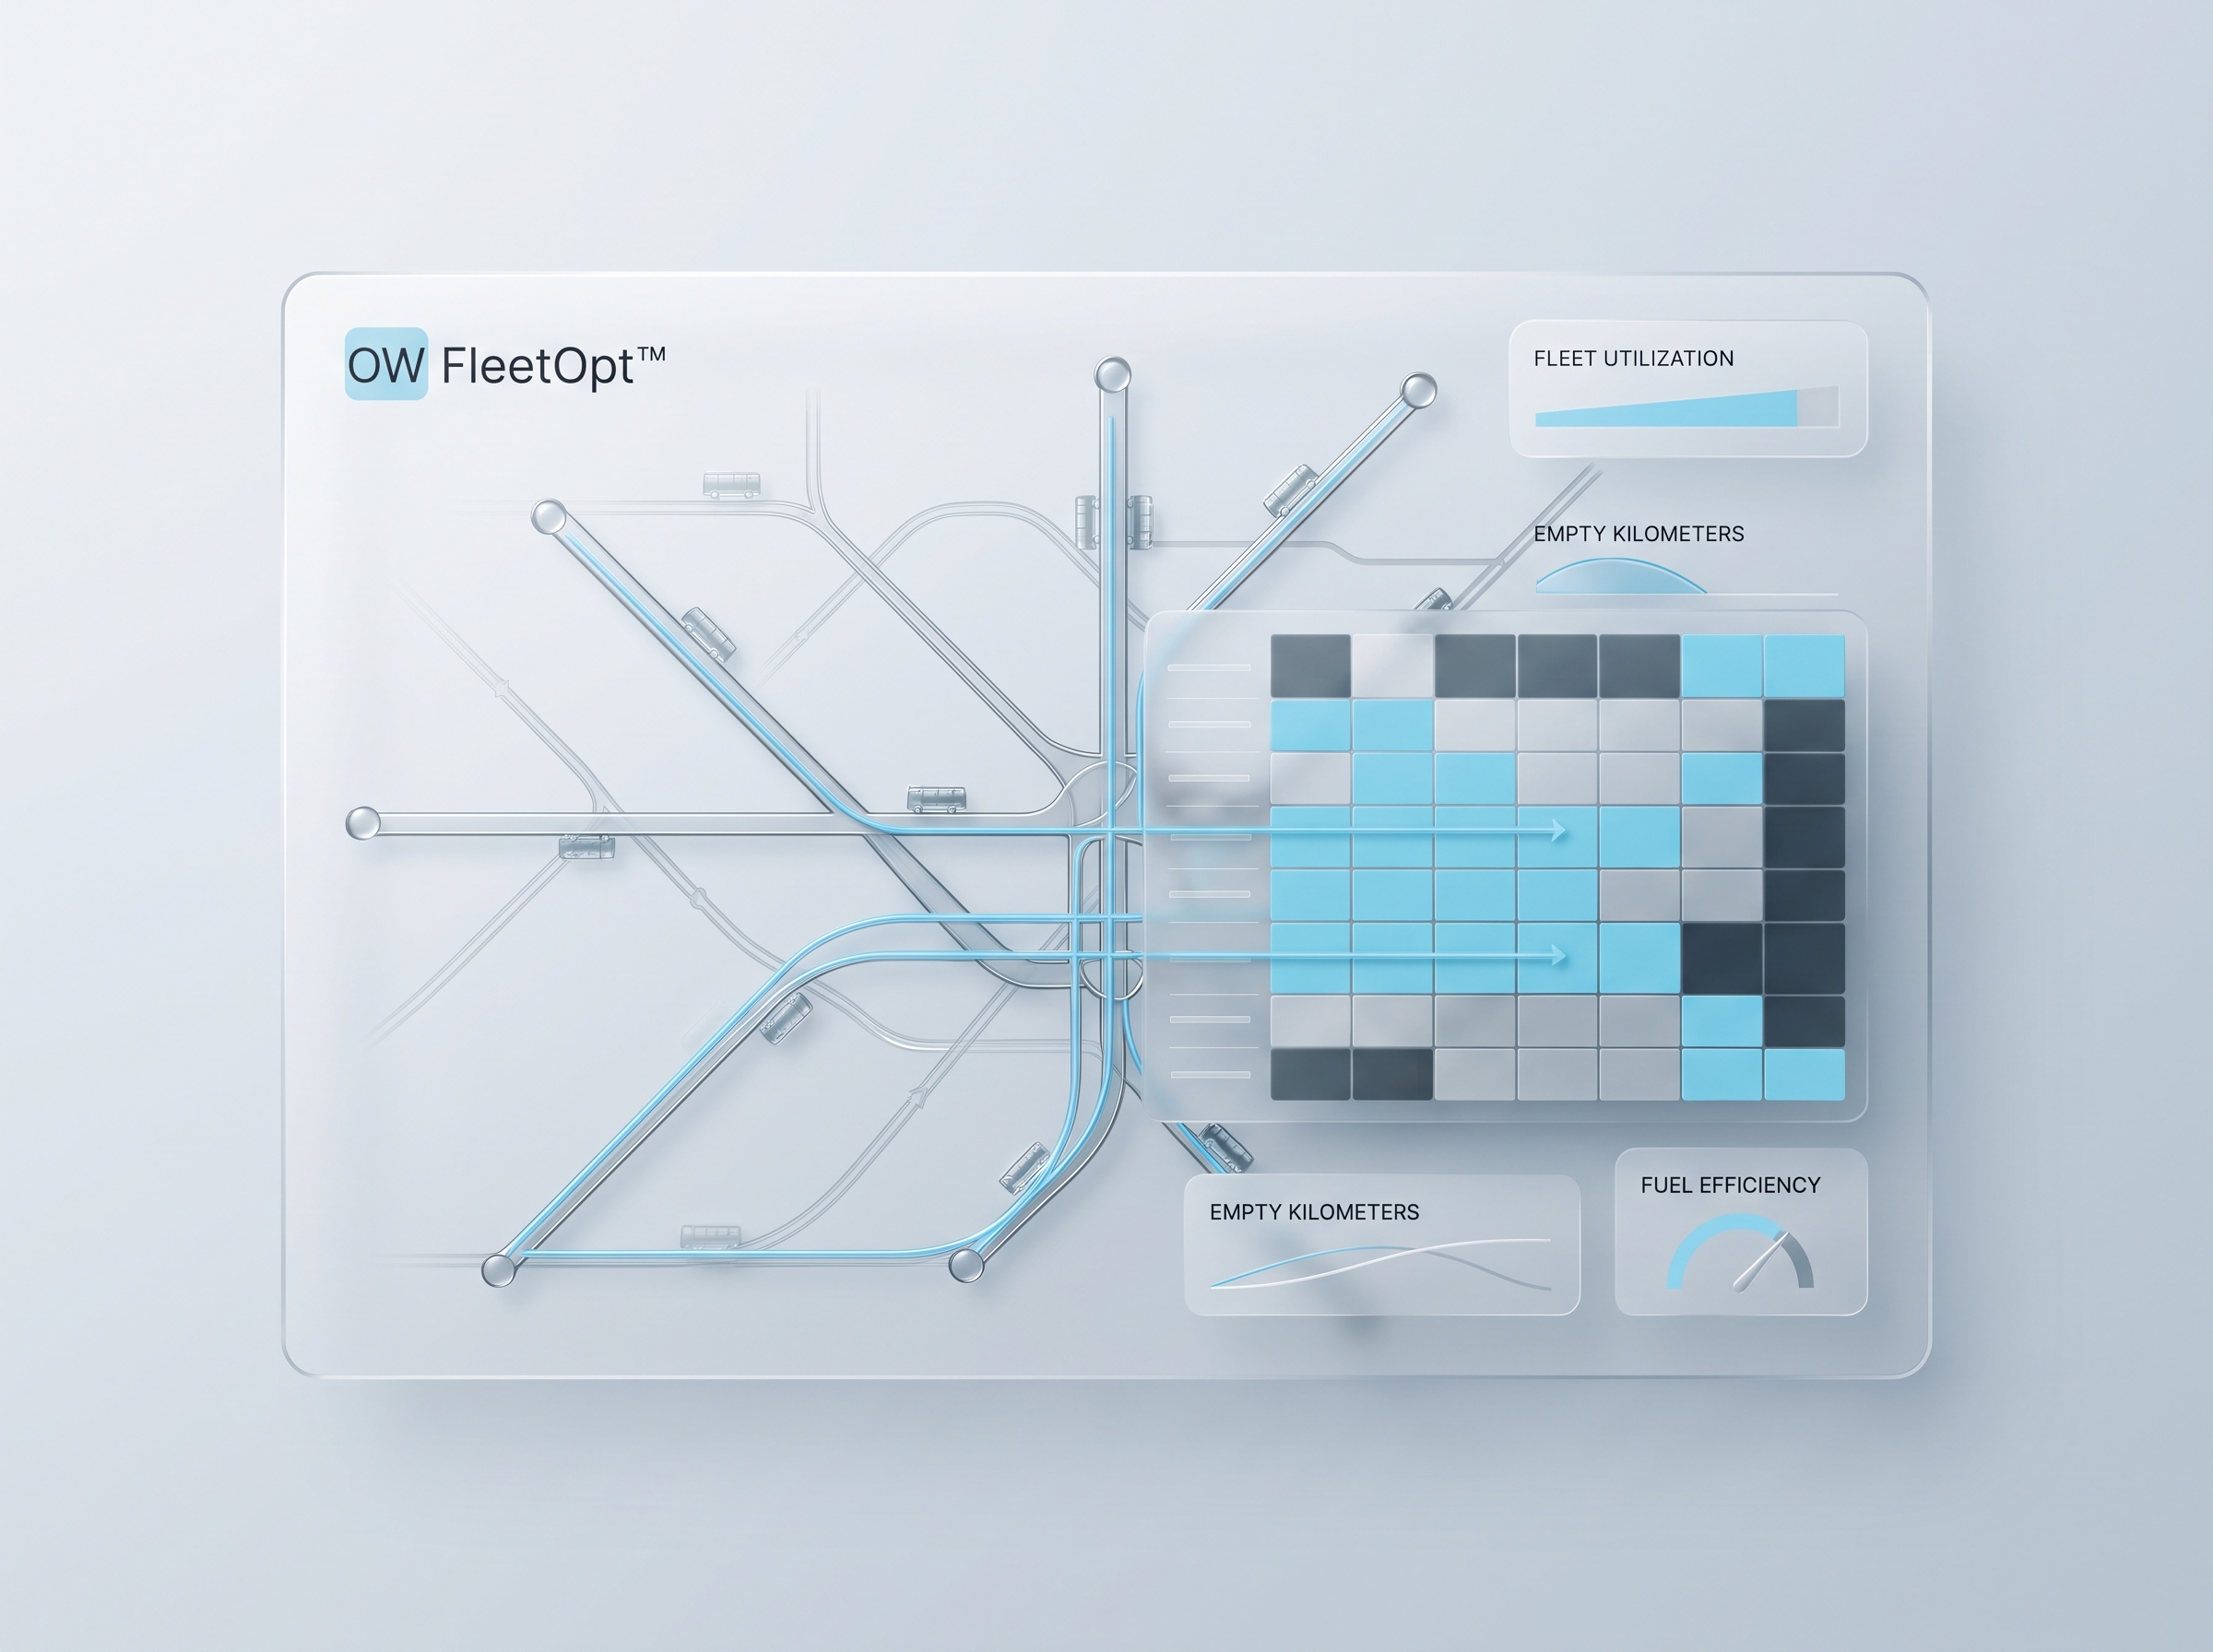
Emission estimates are linked to observed vehicle movements—not averages alone—so empty kilometers, dwell, and speed profiles feed the same optimization loop as service quality. Sustainability levers (fewer deadhead kilometers, better load factors, smarter frequency) are scored alongside reliability so climate targets stay compatible with operational constraints.

View Case StudyIn OW Suite: OW FleetOpt™
OW Optimize the World — electric bus and cyclist illustrating sustainable mobility
OW FleetOpt™In OW Suite
OW FleetOpt™

CITY PLANNING & EQUITY

Who is left out when averages look fine?

System Question

How do choices shape accessibility and equity citywide?

What OW Helps Uncover

  • Spatial coverage gaps and accessibility imbalances
  • Equity impacts of network and service design
  • Service disparities hidden within average indicators

Approach

OW integrates accessibility and equity metrics into system models, enabling planners to evaluate and improve inclusiveness alongside performance.

Technology

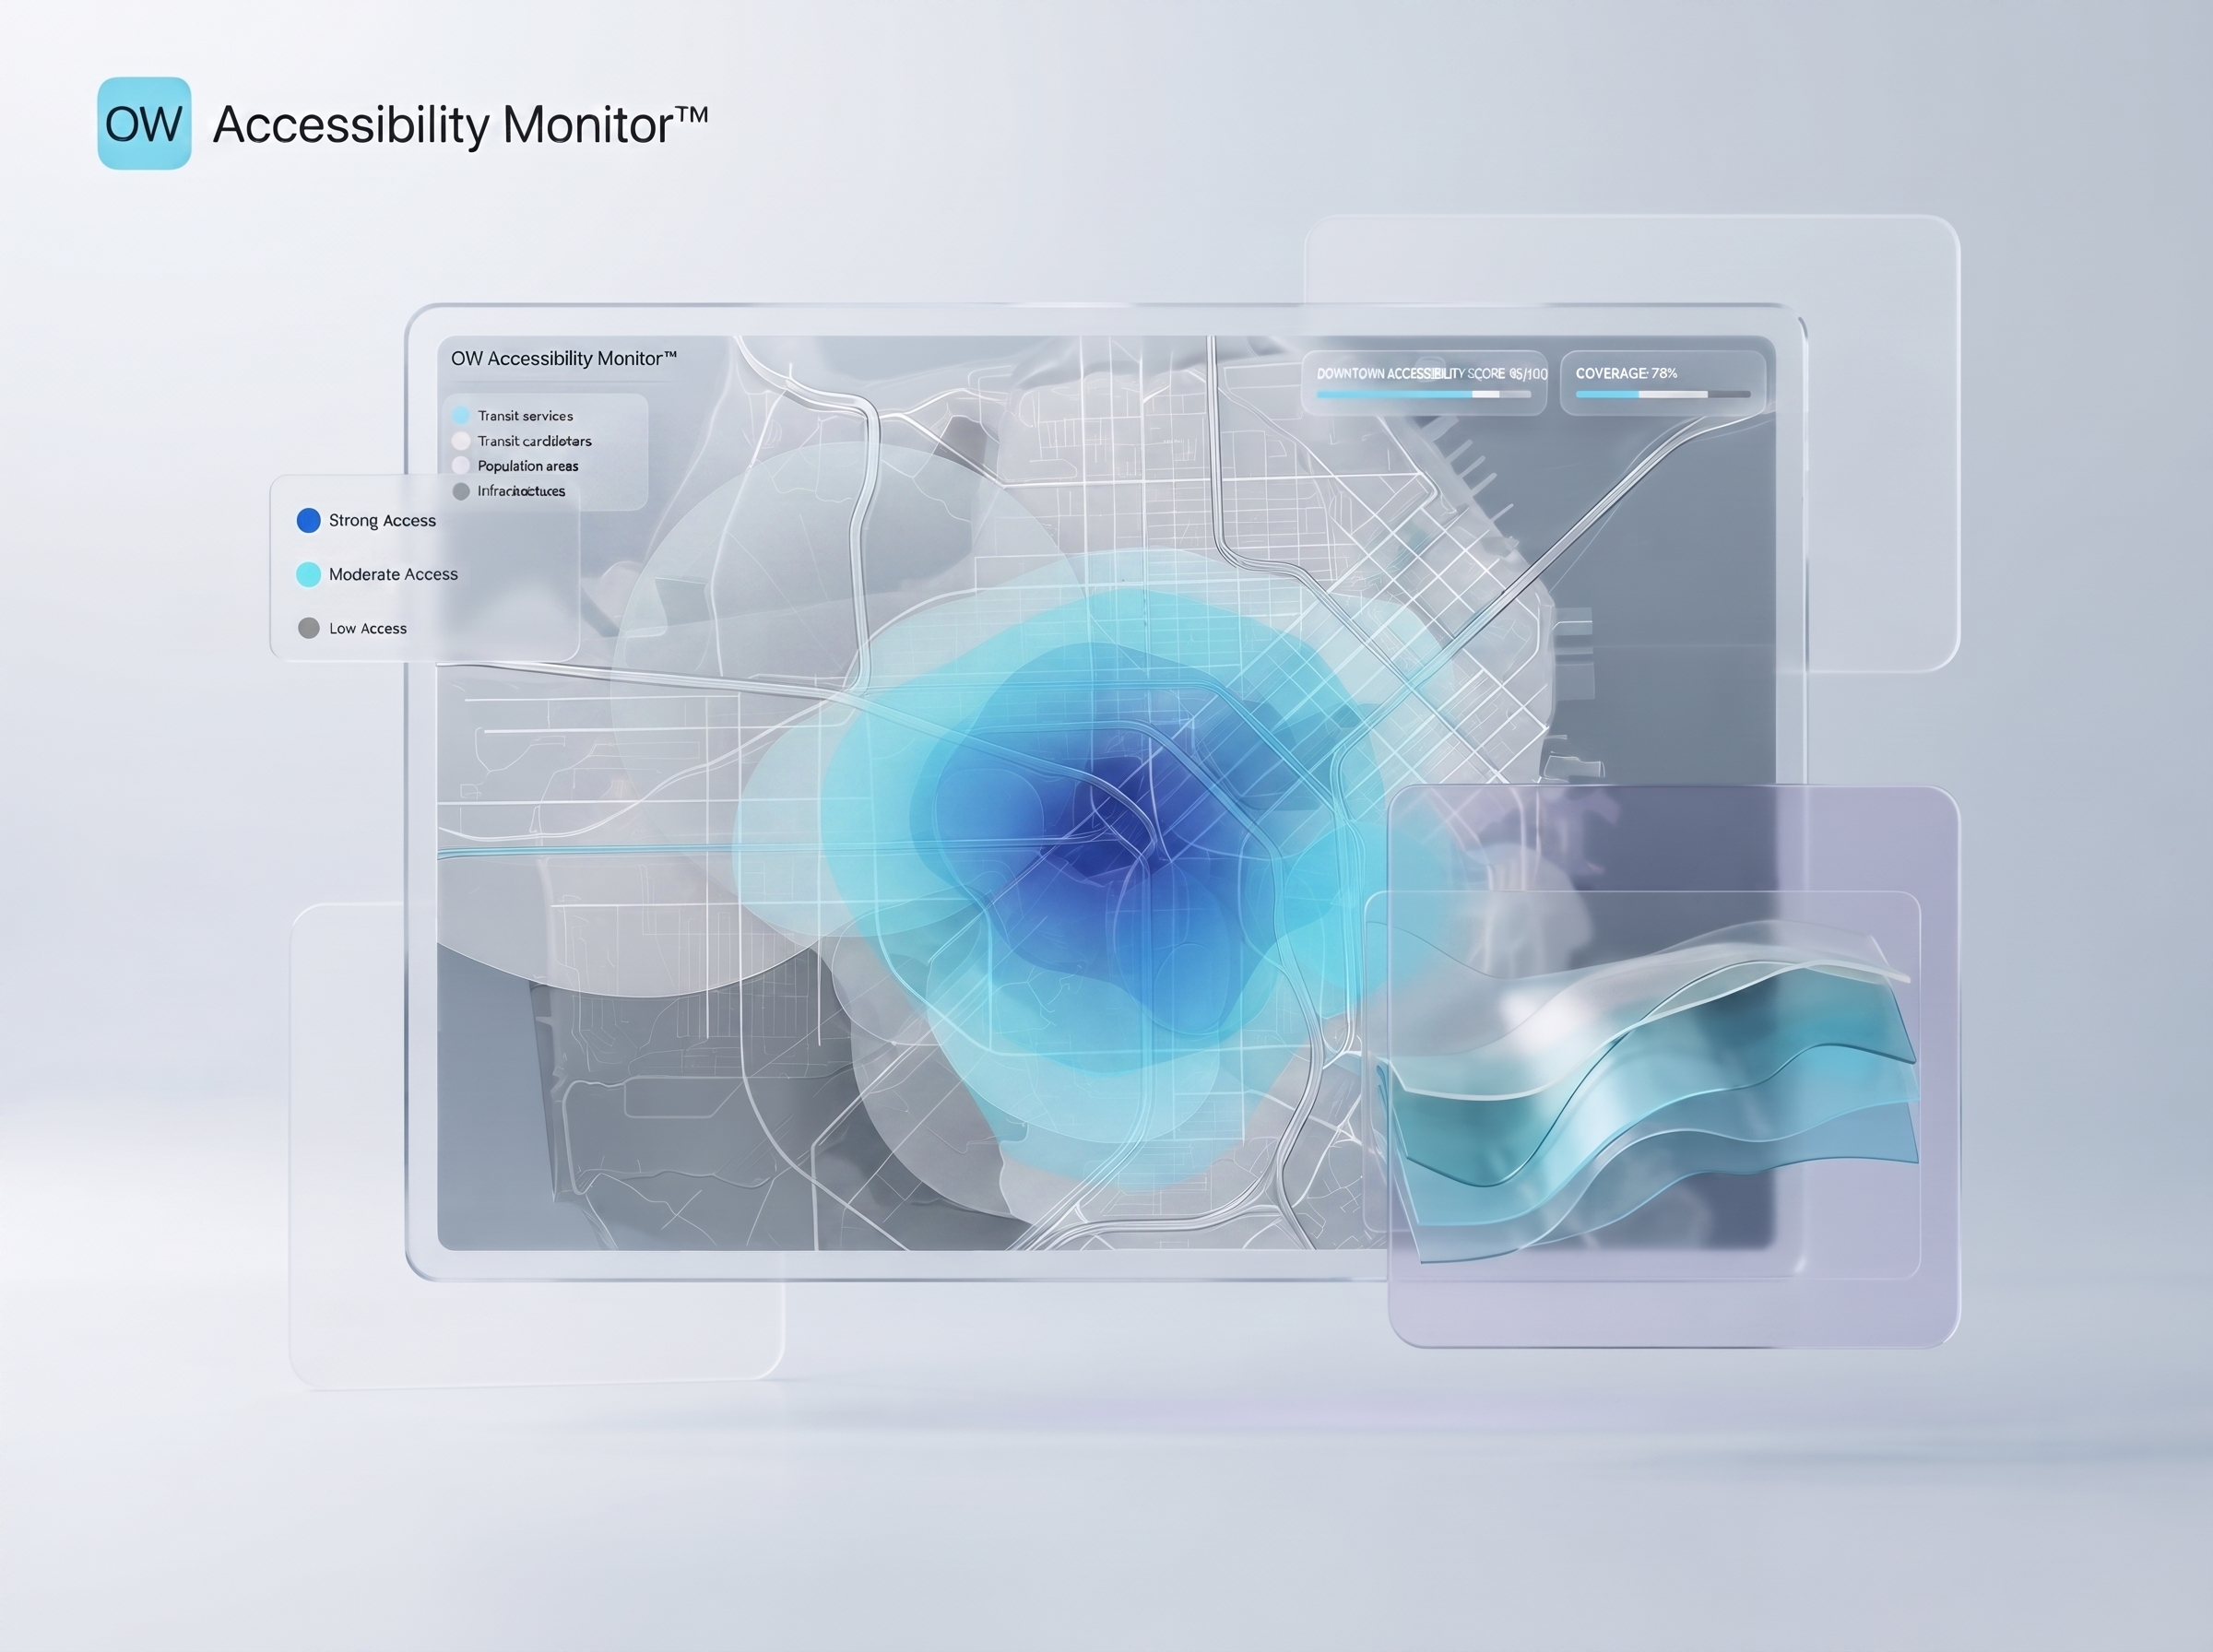
Accessibility analysis combines stop-level GTFS geometry with demand and travel-time surfaces so coverage gaps are visible beyond aggregate mode share. Equity-sensitive metrics can be tracked alongside headway adherence, helping planners prioritize interventions where service quality and inclusion diverge across neighborhoods.

View Case StudyIn OW Suite: OW Accessibility Monitor™
OW Optimize the World — outdoor community meeting on city planning and equity
OW Accessibility Monitor™In OW Suite
OW Accessibility Monitor™

BUSINESS INTELLIGENCE & ANALYTICS

Why does reliability keep declining?

System Question

How can operational data become a foundation for improvement?

What OW Helps Uncover

  • Fragmented data across departments and tools
  • Inconsistent metrics and delayed reporting
  • Decisions driven by intuition rather than evidence

Approach

OW transforms raw data into integrated system models, analytics, and scenario-based insights that support confident, explainable action.

Technology

A unified semantic layer aligns GTFS, AVL, and ticketing feeds so dashboards reference consistent entities (routes, trips, blocks). Drill-downs support deadhead, on-time performance, and crowding KPIs in one graph-aware model, reducing reconciliation work between departments and making scenario comparisons audit-ready.

View Case StudyIn OW Suite: OW Intelligence Hub™
OW Optimize the World — analysts reviewing operational data on screen for decision analytics
OW Intelligence Hub™In OW Suite
OW Intelligence Hub™

Every operational question deserves a measurable answer.

Every challenge is connected. Every solution should be too.

Ready to turn your questions into decisions?