11 min read
Small City Public Transit Optimization: An Efficiency Guide for Limited Budgets

Written by Dr. Ümit Kuvvetli
Founder & Chief Optimization Scientist
When people talk about public transit planning and optimization, the conversation almost always gravitates toward megacities — places with millions of residents, sprawling metro networks, and thousands of buses. Global software giants shape their budgets and algorithms around massive datasets from London, New York, or Istanbul.
But the reality for local governments and transit authorities in smaller cities looks very different. In a budget-constrained town, the conversation in a transit director's office often sounds something like this:
"We have maybe 10 buses total, and most of them run empty for half the day. What exactly are we supposed to optimize?"
This question feeds one of the biggest misconceptions in public transportation: optimization is not a luxury for large cities — it is the most critical lifeline for small cities trying to survive on limited budgets.
In a large metropolis, one bus out of hundreds traveling a few kilometers empty (deadhead) is a statistical rounding error absorbed by a massive budget. But in a city with a fleet of 10 vehicles, a single bus running inefficient routes wastes 10% of total service capacity — directly. The tighter your budget, the more you need optimization.
Why Metropolis Software Fails in Small Cities
Transit planning systems built for large cities are designed to handle billions of live GPS signals, turnstile data, and enormous engineering teams. These systems are expensive, slow to integrate, and architecturally overbuilt.
A small city does not need a jet — it needs a nimble, agile vehicle. The priority for small city transit optimization is not calculating seconds; it is cutting invisible costs while preserving social accessibility.
| Optimization Criterion | Megacity Need | Small City Reality |
|---|---|---|
| Primary Data Source | Live sensors, automated passenger counters | Trip logs and driver field observations |
| Core Goal | 1–2% operational savings (enormous at scale) | 20–30% efficiency gain (budget rescue) |
| Return on Investment | 3–5 years | 6–12 months |
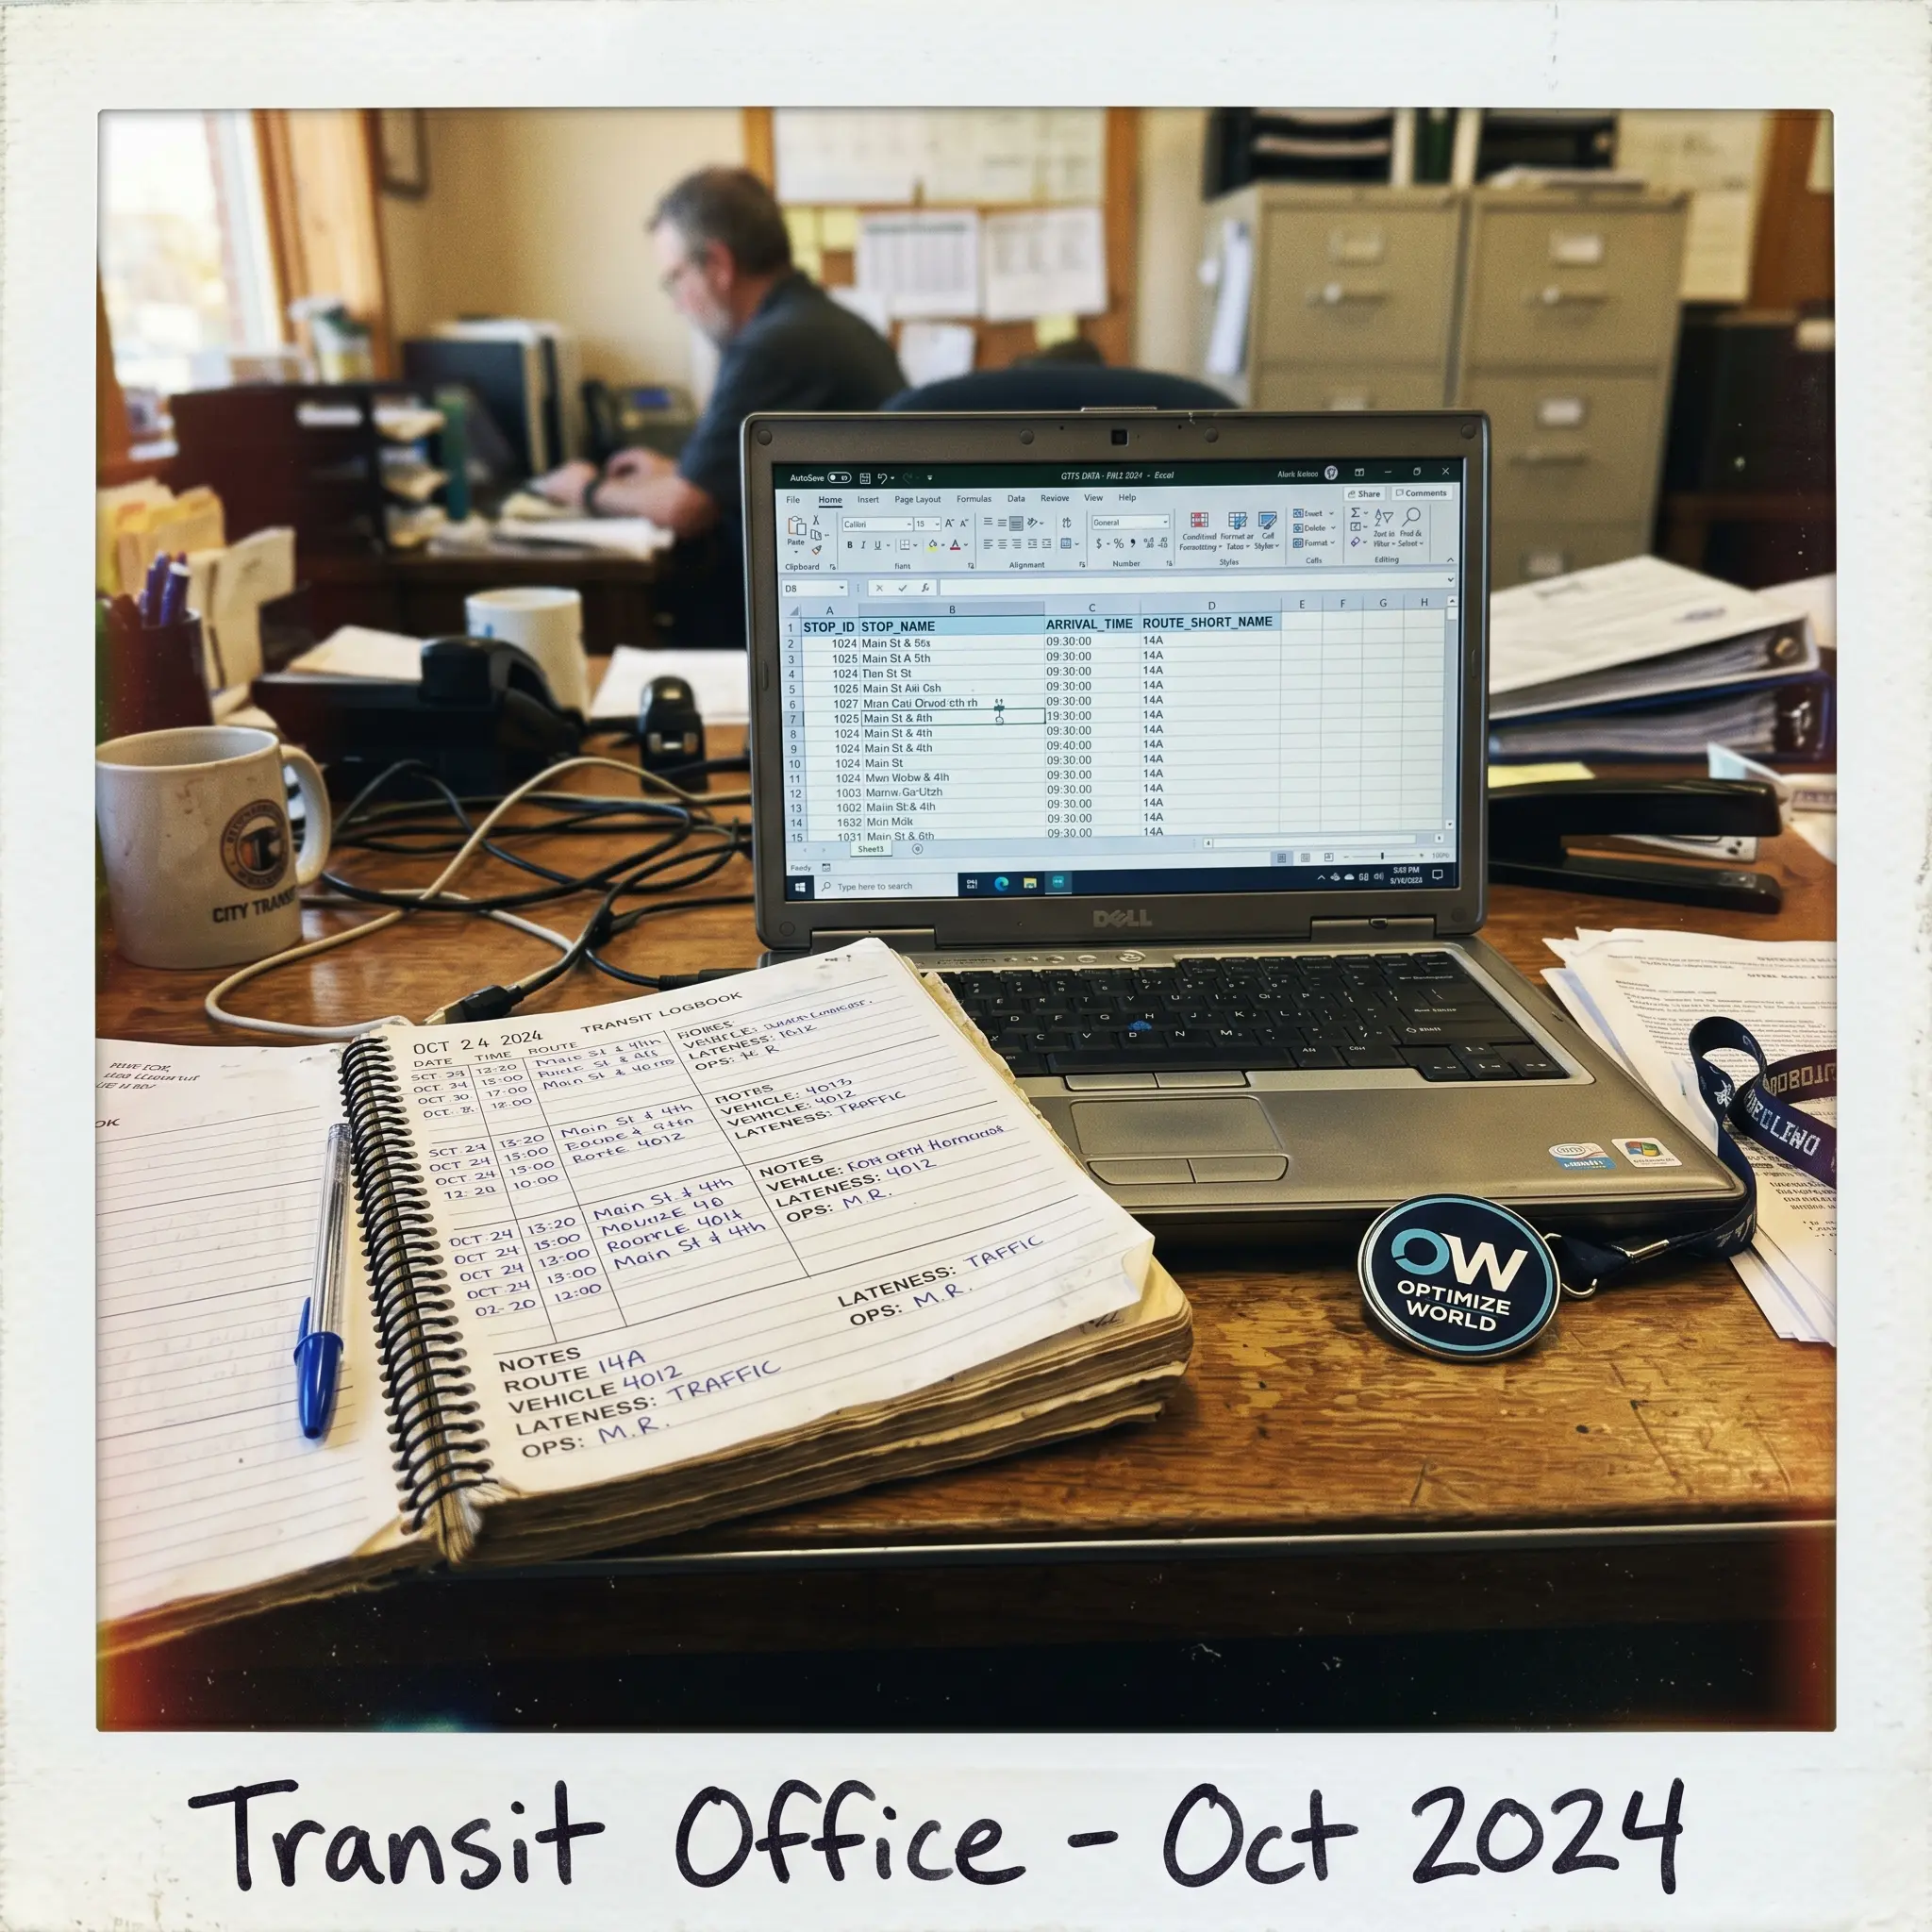
| Operations Team | Data scientists and transport engineers | A single planner talking directly to drivers |
3 Cities, 3 Different Optimization Scenarios

Small cities have dynamics that demand stepping outside standard algorithms and building solutions fitted to each city's unique DNA. Here are three distinct city profiles and their practical optimization paths:
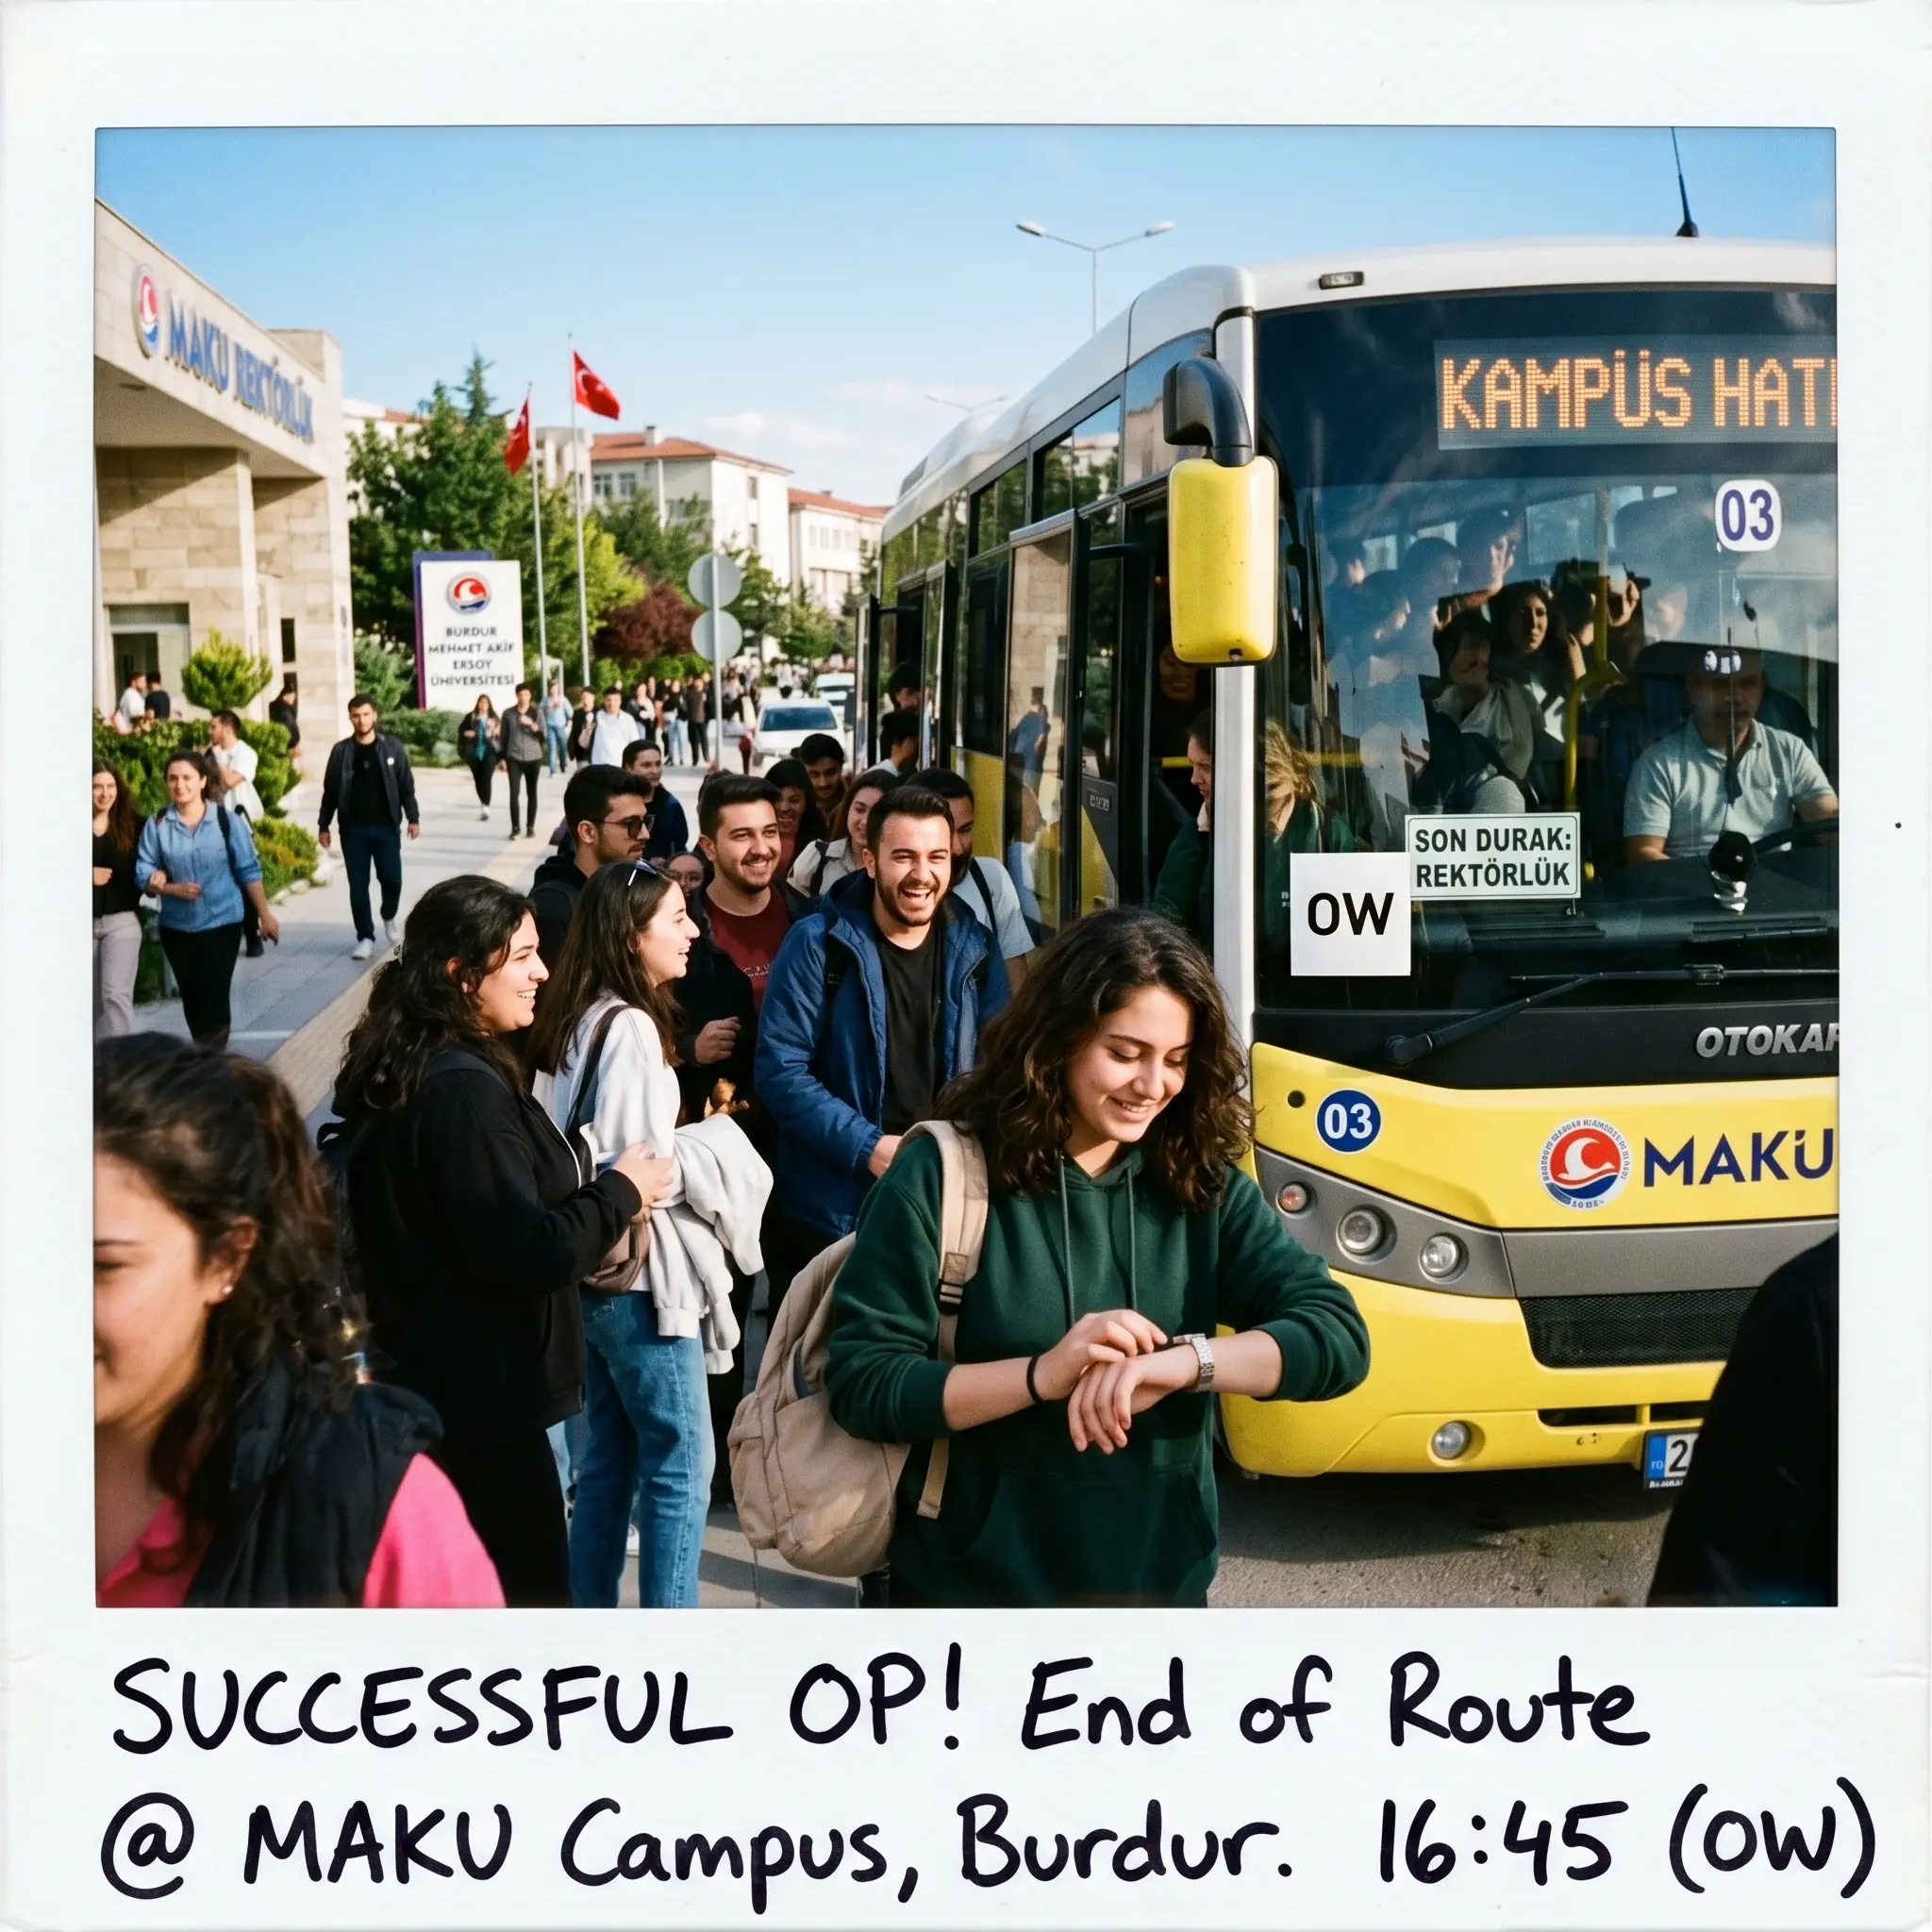
1. A University and Tourism Hub — Managing Seasonal Demand Swings
Picture a mid-sized city shaped by two entirely different populations: summer tourists flooding in for a natural attraction nearby, and tens of thousands of university students who anchor the city's mobility patterns in winter.
- Problem: Running a rigid, fixed schedule year-round means chronic underservice in summer and buses running empty on campus routes in winter. Demand between peak and off-peak seasons can swing by 50–60%.
- Optimization Solution: Flexible scheduling that anticipates seasonal demand breaks. Without any expensive hardware investment, building two separate data-driven tariff matrices — one for the academic calendar, one for the tourism season — directly cuts operational costs.
2. Challenging Geography — The Mathematics of Remote Routes
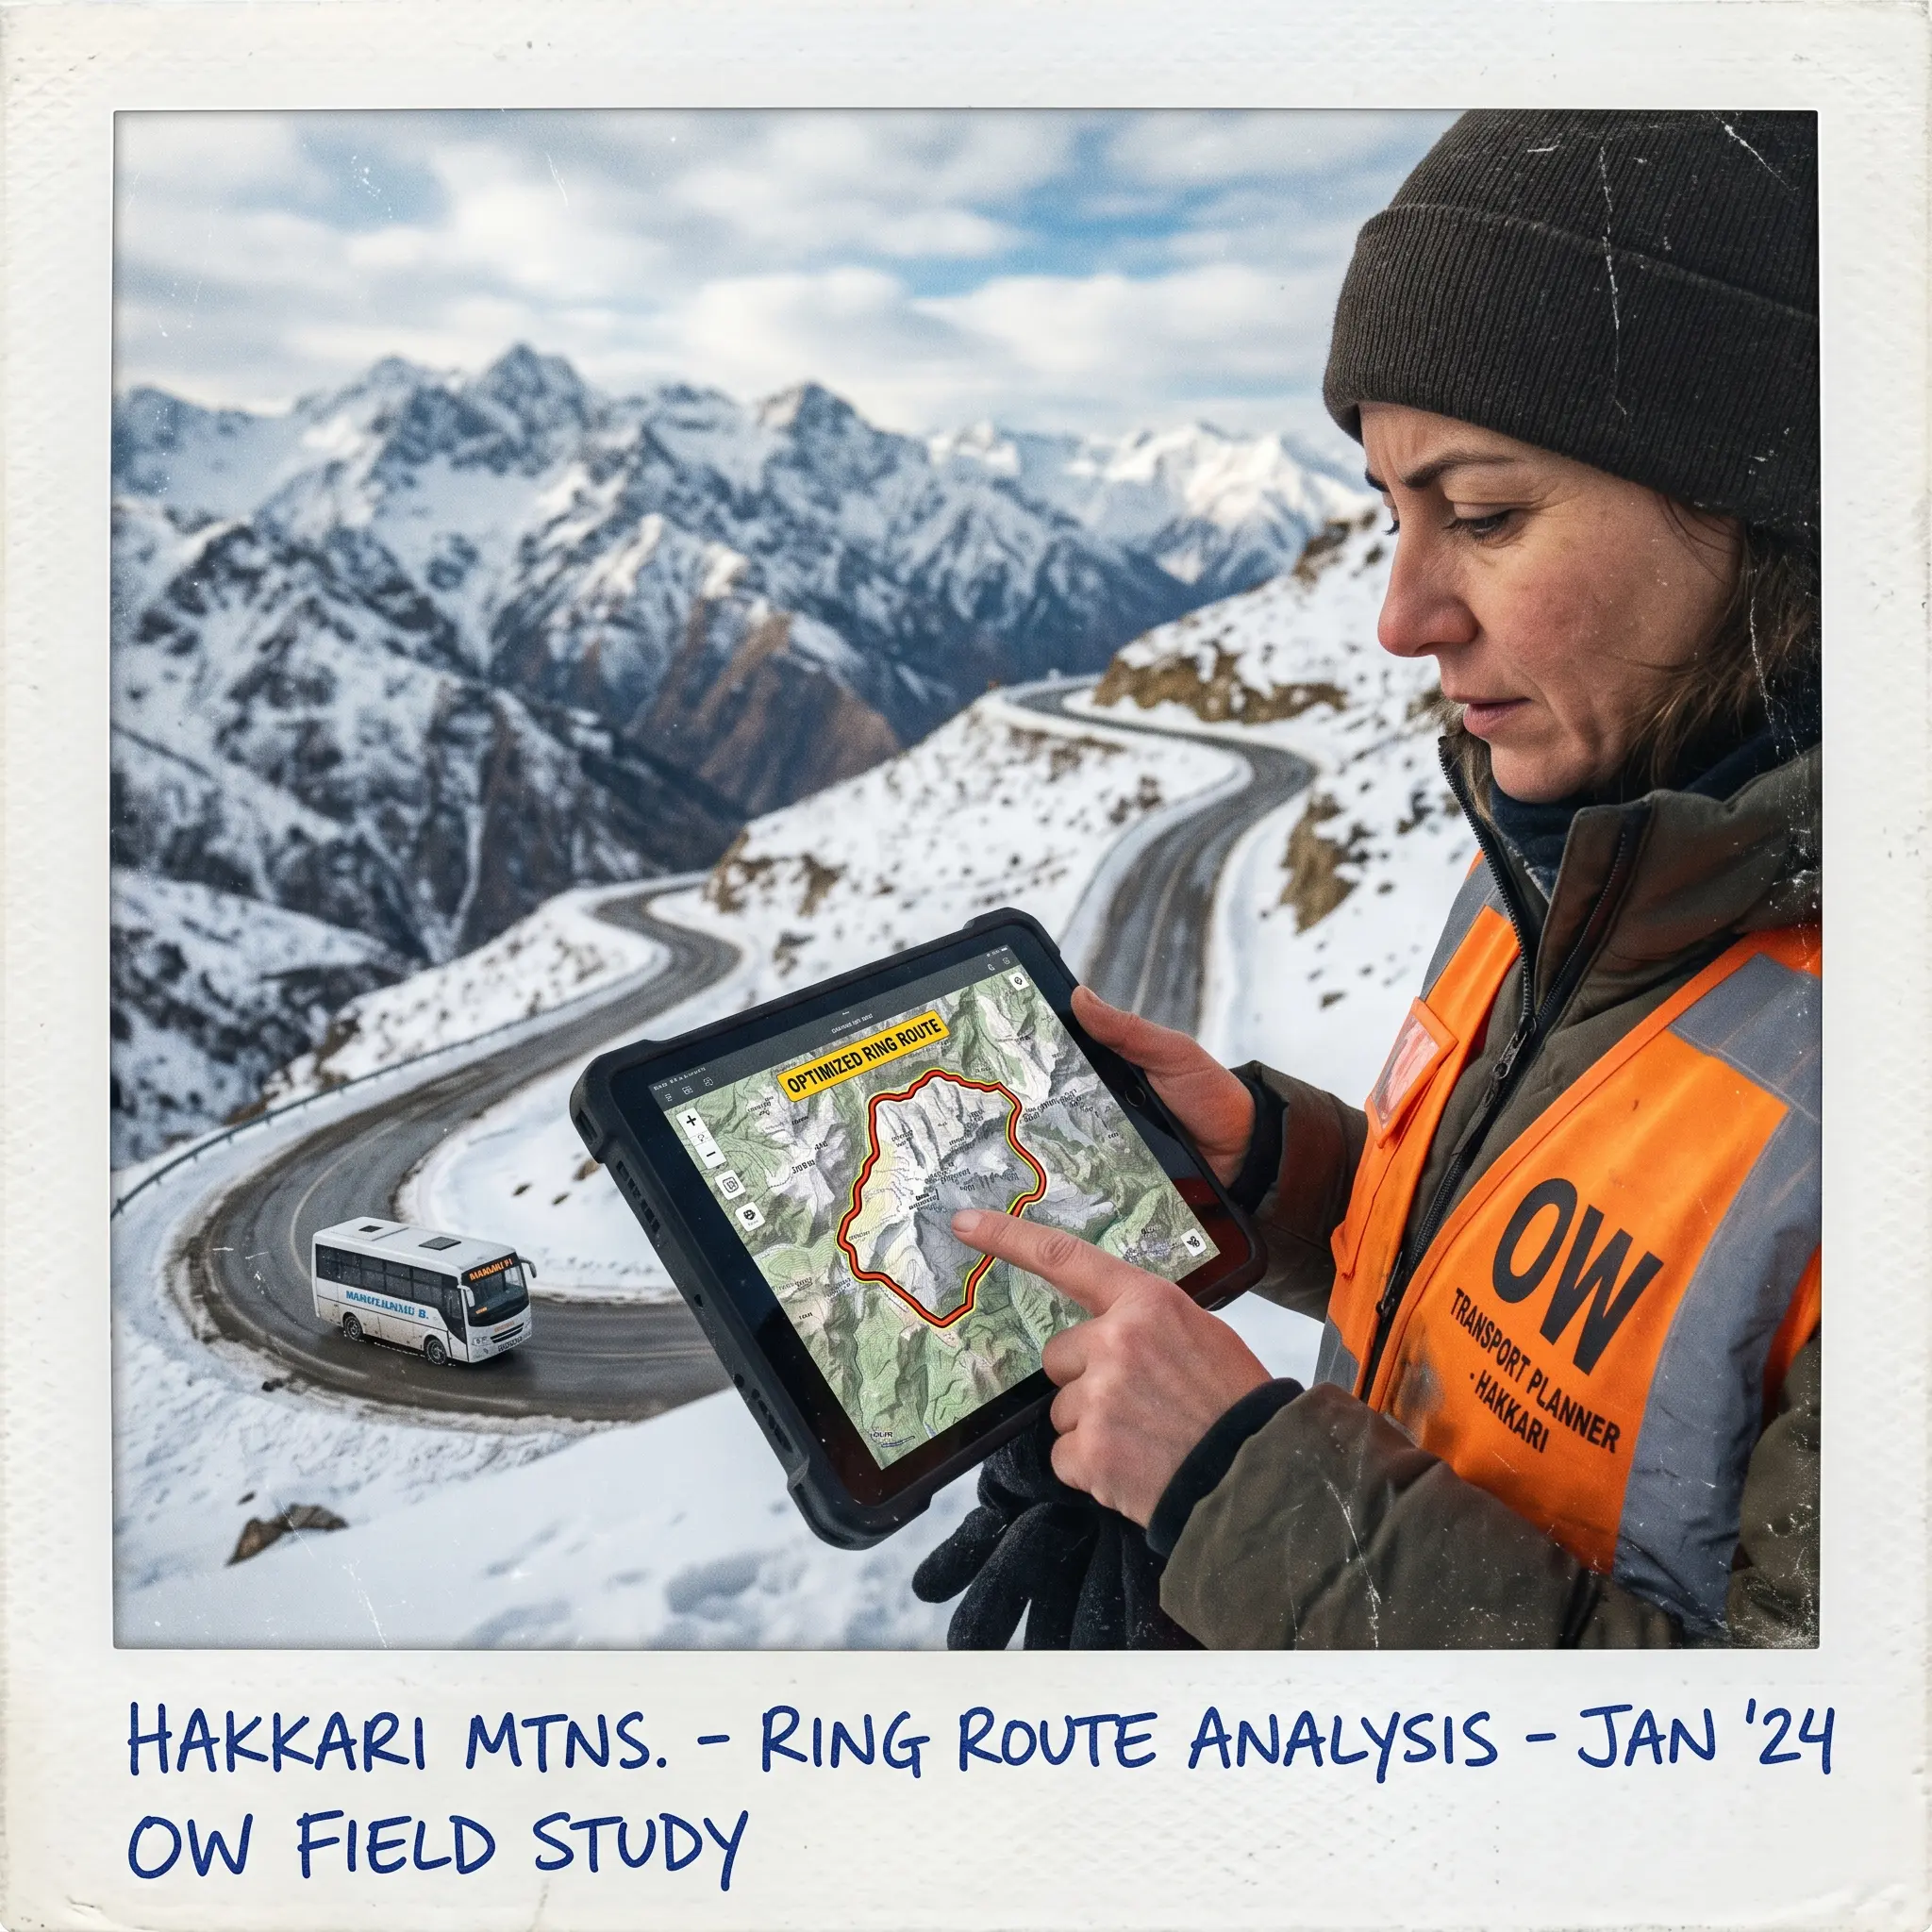
High elevation, steep inclines, narrow streets, and harsh winters. In cities with difficult terrain, transit planning is not just a cost issue — it is a matter of accessibility and social equity.
- Problem: Drawing routes by intuition or old habits causes buses traveling to outlying neighborhoods to return completely empty. That burns fuel, wears vehicles, and consumes driver time with zero service value.
- Optimization Solution: Mixed-Integer Programming (MIP)-based route optimization to map and eliminate deadhead kilometers. A vehicle leaving the city center in the morning can be restructured as a ring route — picking up school or hospital demand from a different neighborhood on the return leg. Same kilometer, twice the output.
3. Aging Population — Transit as a Social Infrastructure

Cities losing young residents to larger employment centers are left with an older demographic where public transit is not a commercial service — it is the primary means by which elderly residents reach a market, a hospital, or any form of social life.
- Problem: Without knowing which neighborhoods need service at which hours, vehicles either run empty at the wrong times or leave elderly residents stranded at stops. Neither outcome is acceptable.
- Optimization Solution: Basic passenger count data analysis. Even without automated fare systems, demand density maps can be built from driver field observations. Idle vehicle capacity gets reallocated around hospital appointment windows and weekly market days.
3 Advantages Small Cities Have That Megacities Don't
Large cities may have enormous budgets, but small cities hold three structural advantages that accelerate real-world impact:
- Piloting is Fast: Testing a new route or system in a large metropolitan area can take months of bureaucratic process. In a small city, you can launch a pilot on 2 buses within a single week, measure results immediately, and iterate with near-zero risk.
- Field Intuition Feeds the Data: Instead of sifting through millions of data points, a conversation with drivers during a coffee break can surface the biggest bottlenecks in minutes. In small cities, operational knowledge is not buried in dashboards — it is accessible.
- Improvements are Felt Immediately: Boosting frequency efficiency by 5% in Istanbul goes unnoticed. But cutting a waiting time from 15 minutes to 8 minutes in a smaller city means every resident notices the change the next day. For local governments, that is a concrete, fast-moving success story.
The "We Have No Budget" Myth: The Real Cost of Not Optimizing
The most common barrier cited by local governments is not having sufficient budget to modernize transit. But the truth is this: not optimizing means burning that software budget in the fuel tank every single day.
Here is the annual loss breakdown for a very small fleet of just 5 buses:
- Total Fleet Capacity: 5 vehicles × 8 hours = 40 vehicle-hours/day
- Average Empty Mileage Rate: 25% (a quarter of the fleet running empty or on inefficient routes)
- Daily Idle Time: 10 vehicle-hours/day wasted
- Average Cost per Vehicle-Hour: ~$30 (driver + fuel + maintenance)
- Daily Direct Loss: $300
- Annual Direct Loss: ~$110,000
For an organization losing over $100,000 per year to inefficient routing, starting data-driven planning is not an expense line — it is the highest-return investment available to close that budget gap.
3 Practical Steps to Start This Week
Before investing in any large-scale system, here are steps you can take right now with your existing resources:
Track Empty Mileage
Ask drivers to note how many kilometers they travel completely empty after each trip. If the rate exceeds 15%, immediate action is needed.
Standardize Your Data (GTFS)
Move your stop names and per-route schedules into a digital format to establish a basic GTFS (General Transit Feed Specification) foundation.
Pick Your Worst Route and Pilot
Identify the single route losing the most money or generating the most complaints. Make 3–5 small adjustments to its timing and alignment, then track results for one week.
Frequently Asked Questions (FAQ)
Is transit optimization expensive for a small city?
No. At the starting stage, no major software investment or complex sensor infrastructure is required. Significant efficiency and fuel savings can be achieved through empty mileage tracking, basic data counts, Excel logs, and correct operational scheduling — with no added burden to the municipality.
How many buses are needed before optimization makes sense?
It makes sense from a single bus. In fact, the fewer vehicles you have, the larger the percentage impact of even one bus running empty. A 5-vehicle fleet losing one bus to inefficient routing loses 20% of total service capacity.
What if our municipality has no data analyst?
You do not need an advanced analytics team. Driver daily field observations and simple passenger counts are sufficient to get started. When the process needs to scale, Optimize the World's small city program provides technical guidance built around real budget constraints.
Measure Your City's Transit Efficiency — Free
Small cities should not have to walk away from large software vendors because the tools were never built for their scale. At Optimize the World, we have built a dedicated support mechanism for local governments and private transit operators serving populations under 200,000.
To understand how much your city's transit network is losing — and what your efficiency potential looks like — you can run a free 15-minute preliminary assessment with our team:
- A simple efficiency analysis of your current route structure and fleet size.
- Identification of your largest hidden loss (empty mileage, schedule conflict, or incorrect departure times).
- 3 immediate action recommendations you can implement this week.
👉 Request Your Free Route Efficiency Check-up
👉 Book a 15-Minute Municipal Consultation
Related Modules
Used in this piece